Smart labels are referred to as product identification slips, an cutting-edge technology that is better than conventional barcode data. The smart labels system consists of antenna, chip, and bonding wires, which are designed to record, receive and transmit digital information significantly reduces the tracking time.
Smart Labels Market Segmentation |
|
| By Technology | 1. Electronic Article Surveillance Labels (EAS) |
| 2. RFID Labels | |
| 3. Sensing Labels | |
| 4. Electronic Shelf/Dynamic Display Labels | |
| 5. Near Field Communication (NFC) Tags | |
| By Application | 1. Equipment |
| 2. Electronics & IT Asset | |
| 3. Retail & Inventory Tracking | |
| 4. Pallets | |
| 5. Perishable Goods | |
| 6. Others | |
| By Component | 1. Transceivers |
| 2. Memories | |
| 3. Batteries | |
| 4. Microprocessors | |
| 5. Others | |
| By End-use Industry | 1. Healthcare |
| 2. Logistics | |
| 3. Retail | |
| 4. Manufacturing | |
| 5. Automotive | |
| 6. Fast-Moving Consumer Goods (FMCG) | |
| 7. Others | |
| By Region | 1. North America (US and Canada) |
| 2. Europe (UK, Germany, France and Rest of Europe) | |
| 3. Asia Pacific (China, Japan, India and Rest of Asia Pacific) | |
| 4. Latin America (Brazil, Mexico and Rest of Latin America) | |
| 5. Middle East & Africa (GCC and Rest of Middle East & Africa) | |
The growth of the smart labels market is primarily driven by an overall reduction in tracking time, protection against theft, loss, and counterfeiting, and lack of human intervention. Moreover, automated and streamlined operations and increase in demand from end-user industries such as retail, healthcare, FMCG, packaging, construction, and automotive are expected to create opportunities for the manufacturers in the global market over the forecast period. However, high costs of the system and lack of standards are expected to hamper the growth of the global smart labels market in the coming years.
The RFID labels segment expected to dominate the market throughout the forecast period
Based on technology, the global smart labels market has been segmented into electronic article surveillance labels (EAS), RFID labels, sensing labels, electronic shelf/dynamic display labels, and near field communication (NFC) tags. The RFID labels segment accounted for approximately 27% of the share in the global smart labels market in 2018.
The major factors that drive the growth of this segment are features of the RFID labels including information accuracy, automatic data capture, flexibility to be applied on several substrates, and real-time tracking. Moreover, the RFID labels are used in various end-use industries such as automotive, retail, healthcare, manufacturing, and FMCG owing to traceability property.
Based on application, the retail inventory segment is expected to dominant the market during the forecast period
Based on application, the market has been segmented into equipment, electronics & IT asset, retail & inventory tracking, pallets, perishable goods, and others. The retail inventory segment accounts of the largest share in the global smart labels market by application.
While the perishable goods segment accounted highest CAGR of around 14.1% in the global smart labels market during the forecast period. Perishable goods are used in this food & beverages and healthcare industry, due to its ability to track changes in temperature, oxygen, and other environmental factors.
Based on component, the memories segment is expected to grow at a CAGR of around 16% throughout the forecast period
Based on the component, the market has been segmented into transceivers, memories, batteries, microprocessors, and others. The memories segment accounts of the largest share in the market and are expected to grow at a CAGR of around 16% during the forecast period. The major factors that drive the growth of this segment are increasing use in asset tracking and inventory management.
Based on end-use industry, the healthcare segment is expected to dominate during the forecast period
Based on end-use industry, the market has been segmented into healthcare, logistics, retail, manufacturing, automotive, fast-moving consumer goods (FMCG), and others. The healthcare segment accounts of the largest share in the market and held for more than 50% of the total market in 2018. The major factors that are driving the growth of this segment are increasing usage of this technology in spoil detection of test samples, hospital goods, drugs, and medical equipment.
The manufacturers Avery Dennison Corporation, CCL Industries, Inc., and Checkpoint Systems, Inc. are the mainly investing in the development of smart labels for the healthcare industries, which expected the lead the market in the coming years.
Asia-Pacific to dominate the smart labels market throughout the forecast period
Asia-Pacific accounted for nearly 42% share of the global smart labels market in 2018 and is expected to dominate the market throughout the forecast period. The rapid growth in the urbanization and liberalization of foreign direct investment in the various industries are the major driving factor for the region in the global market. Moreover, rapid industrialization, low labor costs, emerging economic conditions increase its dominance in the global smart labels market in future.
North America is expected to hold the highest CAGR in the global market during the forecast period. The manufacturers are investing in North American countries to meet the demand for tracking systems. The increasing demand for nutritional & healthy products and diversification in the region’s food sector are expected to enhance the market growth in the global smart labels market during the forecast.
Company Profiles and Competitive Intelligence:
The major players operating in the global smart labels market are The Avery Dennison Corporation (US), CCL Industries, Inc. (Canada), Checkpoint Systems, Inc. (US), Sato Holdings Corporation (Japan), Smartrac N.V. (The Netherlands), Zebra Technologies (US), Thin Film Electronics ASA (Norway), ASK S.A. (France), Graphic Label, Inc. (US), and Muhlbauer Holding Ag & Co. Kgaa. (Germany) among others.

Ask for free product review call with the author

Share your specific research requirements for a customized report

Request for due diligence and consumer centric studies

Request for study updates, segment specific and country level reports
Chapter 1 Executive Summary
1.1. Market Summary
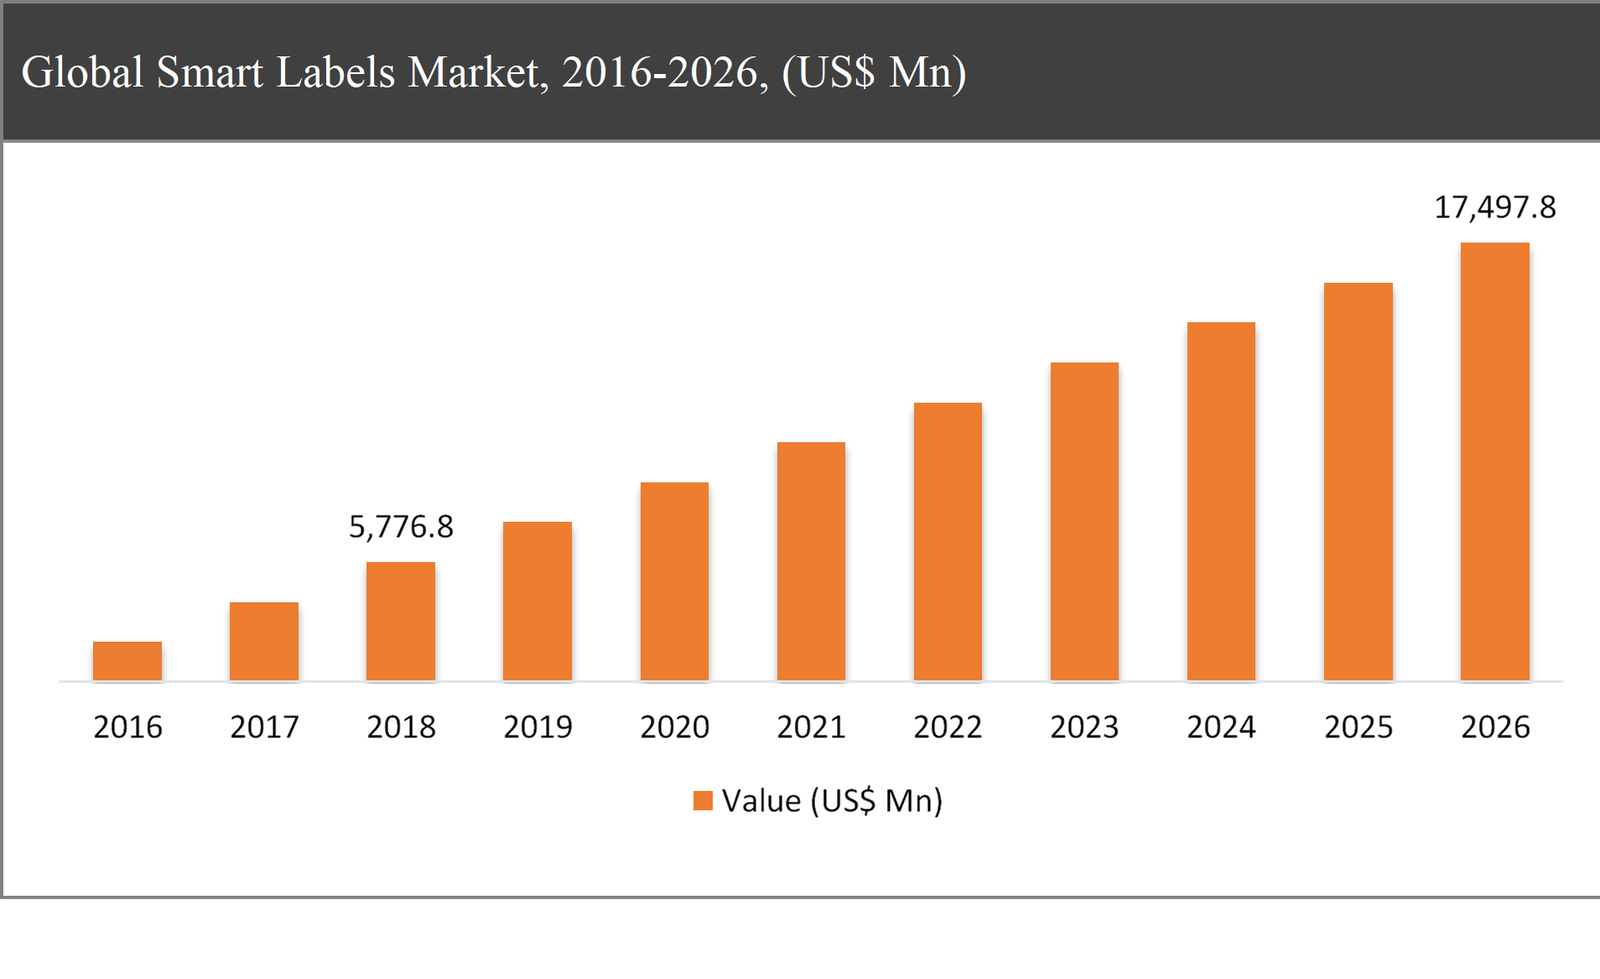
1.1.1. Global Smart Labels Market, 2016-2026, (USD Million)
1.2. Market Snapshot: Global Smart Labels Market
1.3. Market Dynamics
1.4. Global Smart Labels Market, by Segment, 2018
1.4.1. Global Smart Labels Market, by Technology, 2018, (USD Million)
1.4.2. Global Smart Labels Market, by Component, 2018, (USD Million)
1.4.3. Global Smart Labels Market, by End-Use Industry, 2018, (USD Million)
1.4.4. Global Smart Labels Market, by Application, 2018, (USD Million)
1.4.5. Global Smart Labels Market, by Region, 2018 (USD Million)
1.5. Premium Insights
1.5.1. Smart Labels Market In Developed Vs. Developing Economies, 2018 vs 2026
1.5.2. Global Smart Labels Market: Regional Life Cycle Analysis
Chapter 2 Market Dynamics
2.1. Market Overview
2.2. Market Drivers
2.2.1. Growing demand for smart labels in end user industries
2.2.2. Increase in demand for safety across product packaging
2.3. Market Restraints
2.3.1. Lack of standards
2.3.2. Fluctuating costs of raw material
2.4. Market Opportunities
2.4.1. Technological advancements in printed electronics
2.4.2. Increasing demand in logistics
2.5. Industry Value Chain Analysis
2.6. Pricing Analysis
2.7. Porter’s Five Forces Analysis
Chapter 3 Global Smart Labels Market, by Technology
3.1. Market Overview, by Technology
3.1.1. Global Smart Labels Market, by Technology, 2016-2026 (USD Million)
3.1.2. Incremental Opportunity, by Technology, 2018
3.2. Electronic article surveillance labels (EAS)
3.2.1. Global Smart Labels Market, by Electronic article surveillance labels (EAS), 2016-2026, (USD Million)
3.3. Electronic & It Assets
3.3.1. Global Smart Labels Market, by Electronic & It Assets, 2016-2026, (USD Million)
3.4. Sensing Labels
3.4.1. Global Smart Labels Market, by Sensing Labels, 2016-2026, (USD Million)
3.5. Electronic Shelf/Dynamic Display Labels
3.5.1. Global Smart Labels Market, by Electronic Shelf/Dynamic Display Labels, 2016-2026, (USD Million)
3.6. Near Field Communication (NFC) Tags
3.6.1. Global Smart Labels Market, by Near Field Communication (NFC) Tags, 2016-2026, (USD Million)
Chapter 4 Global Smart Labels Market, by Component
4.1. Market Overview, by Component
4.1.1. Global Smart Labels Market, by Component, 2016-2026 (USD Million)
4.1.2. Incremental Opportunity, by Component, 2018
4.2. Memories
4.2.1. Global Smart Labels Market, by Memories, 2016-2026, (USD Million)
4.3. Transceivers
4.3.1. Global Smart Labels Market, by Transceivers, 2016-2026, (USD Million)
4.4. Batteries
4.4.1. Global Smart Labels Market, by Batteries, 2016-2026, (USD Million)
4.5. Microprocessors
4.5.1. Global Smart Labels Market, by Microprocessors, 2016-2026, (USD Million)
4.6. Others
4.6.1. Global Smart Labels Market, by Others, 2016-2026, (USD Million)
Chapter 5 Global Smart Labels Market, by End-Use Industry
5.1. Market Overview, by End-Use Industry
5.1.1. Global Smart Labels Market, by End-Use Industry, 2016-2026 (USD Million)
5.1.2. Incremental Opportunity, by End-Use Industry, 2018
5.2. Healthcare
5.2.1. Global Smart Labels Market, by Healthcare, 2016-2026, (USD Million)
5.3. Logistics
5.3.1. Global Smart Labels Market, by Logistics, 2016-2026, (USD Million)
5.4. Retail
5.4.1. Global Smart Labels Market, by Retail, 2016-2026, (USD Million)
5.5. Manufacturing
5.5.1. Global Smart Labels Market, by Manufacturing, 2016-2026, (USD Million)
5.6. Beverages
5.6.1. Global Smart Labels Market, by Beverages, 2016-2026, (USD Million)
5.7. Automotive
5.7.1. Global Smart Labels Market, by Automotive, 2016-2026, (USD Million)
5.8. Fast-Moving Consumer Goods (FMCG)
5.8.1. Global Smart Labels Market, by Fast-Moving Consumer Goods (FMCG), 2016-2026, (USD Million)
5.9. Others
5.9.1. Global Smart Labels Market, by Others, 2016-2026, (USD Million)
Chapter 6 Global Smart Labels Market, by Application
6.1. Market Overview, by Application
6.1.1. Global Smart Labels Market, by Application, 2016-2026 (USD Million)
6.1.2. Incremental Opportunity, by Application, 2018
6.2. Retail Inventory
6.2.1. Global Smart Labels Market, by Retail Inventory, 2016-2026, (USD Million)
6.3. Perishable Goods
6.3.1. Global Smart Labels Market, by Perishable Goods, 2016-2026, (USD Million)
6.4. Electronic & It Assets
6.4.1. Global Smart Labels Market, by Electronic & It Assets, 2016-2026, (USD Million)
6.5. Pallets Tracking
6.5.1. Global Smart Labels Market, by Pallets Tracking, 2016-2026, (USD Million)
6.6. Equipment
6.6.1. Global Smart Labels Market, by Equipment, 2016-2026, (USD Million)
6.7. Others
6.7.1. Global Smart Labels Market, by Others, 2016-2026, (USD Million)
Chapter 7 Global Smart Labels Market, by Region
7.1. Market Overview, by Region
7.1.1. Global Smart Labels Market, by Region, 2016-2026, (USD Million)
7.2. Attractive Investment Opportunity, by Region, 2018
7.3. North America Smart Labels Market
7.3.1. North America Smart Labels Market, by Technology, 2016-2026 (USD Million)
7.3.2. North America Smart Labels Market, by Component, 2016-2026 (USD Million)
7.3.3. North America Smart Labels Market, by End-Use Industry, 2016-2026 (USD Million)
7.3.4. North America Smart Labels Market, by Application, 2016-2026 (USD Million)
7.3.5. United States Smart Labels Market, 2016-2026 (USD Million)
7.3.6. Canada Smart Labels Market, 2016-2026 (USD Million)
7.4. Europe Smart Labels Market
7.4.1. Europe Smart Labels Market, by Technology, 2016-2026 (USD Million)
7.4.2. Europe Smart Labels Market, by Component, 2016-2026 (USD Million)
7.4.3. Europe Smart Labels Market, by End-Use Industry, 2016-2026 (USD Million)
7.4.4. Europe Smart Labels Market, by Application, 2016-2026 (USD Million)
7.4.5. United Kingdom Smart Labels Market, 2016-2026 (USD Million)
7.4.6. Germany Smart Labels Market, 2016-2026 (USD Million)
7.4.7. France Smart Labels Market, 2016-2026 (USD Million)
7.4.8. Rest of Europe Smart Labels Market, 2016-2026 (USD Million)
7.5. Asia Pacific Smart Labels Market
7.5.1. Asia Pacific Smart Labels Market, by Technology, 2016-2026 (USD Million)
7.5.2. Asia Pacific Smart Labels Market, by Component, 2016-2026 (USD Million)
7.5.3. Asia Pacific Smart Labels Market, by End-Use Industry, 2016-2026 (USD Million)
7.5.4. Asia Pacific Smart Labels Market, by Application, 2016-2026 (USD Million)
7.5.5. China Smart Labels Market, 2016-2026 (USD Million)
7.5.6. Japan Smart Labels Market, 2016-2026 (USD Million)
7.5.7. India Smart Labels Market, 2016-2026 (USD Million)
7.5.8. Rest of Asia Pacific Smart Labels Market, 2016-2026 (USD Million)
7.6. Latin America Smart Labels Market
7.6.1. Latin America Smart Labels Market, by Technology, 2016-2026 (USD Million)
7.6.2. Latin America Smart Labels Market, by Component, 2016-2026 (USD Million)
7.6.3. Latin America Smart Labels Market, by End-Use Industry, 2016-2026 (USD Million)
7.6.4. Latin America Smart Labels Market, by Application, 2016-2026 (USD Million)
7.6.5. Brazil Smart Labels Market, 2016-2026 (USD Million)
7.6.6. Mexico Smart Labels Market, 2016-2026 (USD Million)
7.6.7. Rest of Latin America Smart Labels Market, 2016-2026 (USD Million)
7.7. Middle East & Africa Smart Labels Market
7.7.1. Middle East & Africa Smart Labels Market, by Technology, 2016-2026 (USD Million)
7.7.2. Middle East & Africa Smart Labels Market, by Component, 2016-2026 (USD Million)
7.7.3. Middle East & Africa Smart Labels Market, by End-Use Industry, 2016-2026 (USD Million)
7.7.4. Middle East & Africa Smart Labels Market, by Application, 2016-2026 (USD Million)
7.7.5. GCC Smart Labels Market, 2016-2026 (USD Million)
7.7.6. Rest of Middle East & Africa Smart Labels Market, 2016-2026 (USD Million)
Chapter 8 Competitive Intelligence
8.1. Top 5 Players Comparison
8.2. Market Positioning of Key Players, 2018
8.3. Market Players Mapping
8.3.1. By Technology
8.3.2. By Component
8.3.3. By End-Use Industry
8.3.4. By Application
8.3.5. By Region
8.4. Strategies Adopted by Key Market Players
8.5. Recent Developments in the Market
8.5.1. Mergers & Acquisitions, Partnership, New Technology Developments
Chapter 9 Company Profiles
9.1. Avery Dennison Corporation
9.1.1. Avery Dennison Corporation Overview
9.1.2. Avery Dennison Corporation Technology Portfolio
9.1.3. Avery Dennison Corporation Financial Overview
9.1.4. Avery Dennison Corporation News/Recent Developments
9.2. CCL Industries, Inc.
9.2.1. CCL Industries, Inc. Overview
9.2.2. CCL Industries, Inc. Technologys Portfolio
9.2.3. CCL Industries, Inc. Financial Overview
9.2.4. CCL Industries, Inc. News/Recent Developments
9.3. Checkpoint Systems, Inc.
9.3.1. Checkpoint Systems, Inc. Overview
9.3.2. Checkpoint Systems, Inc. Technologys Portfolio
9.3.3. Checkpoint Systems, Inc. Financial Overview
9.3.4. Checkpoint Systems, Inc. News/Recent Developments
9.4. Sato Holdings Corporation
9.4.1. Sato Holdings Corporation Overview
9.4.2. Sato Holdings Corporation Technologys Portfolio
9.4.3. Sato Holdings Corporation Financial Overview
9.4.4. Sato Holdings Corporation News/Recent Developments
9.5. Smartrac N.V.
9.5.1. Smartrac N.V. Overview
9.5.2. Smartrac N.V. Technologys Portfolio
9.5.3. Smartrac N.V. Financial Overview
9.5.4. Smartrac N.V. News/Recent Developments
9.6. Zebra Technologies
9.6.1. Zebra Technologies Overview
9.6.2. Zebra Technologies Technologys Portfolio
9.6.3. Zebra Technologies Financial Overview
9.6.4. Zebra Technologies News/Recent Developments
9.7. Thin Film Electronics ASA
9.7.1. Thin Film Electronics ASA Overview
9.7.2. Thin Film Electronics ASA Technologys Portfolio
9.7.3. Thin Film Electronics ASA Financial Overview
9.7.4. Thin Film Electronics ASA News/Recent Developments
9.8. ASK S.A.
9.8.1. ASK S.A. Overview
9.8.2. ASK S.A. Technologys Portfolio
9.8.3. ASK S.A. Financial Overview
9.8.4. ASK S.A. News/Recent Developments
9.9. Graphic Label, Inc.
9.9.1. Graphic Label, Inc. Overview
9.9.2. Graphic Label, Inc. Technologys Portfolio
9.9.3. Graphic Label, Inc. Financial Overview
9.9.4. Graphic Label, Inc. News/Recent Developments
9.10. Muhlbauer Holding Ag & Co. Kgaa.
9.10.1. Muhlbauer Holding Ag & Co. Kgaa. Overview
9.10.2. Muhlbauer Holding Ag & Co. Kgaa. Technologys Portfolio
9.10.3. Muhlbauer Holding Ag & Co. Kgaa. Financial Overview
9.10.4. Muhlbauer Holding Ag & Co. Kgaa. News/Recent Developments
Chapter 10 Preface
10.1. Data Triangulation
10.2. Research Methodology
10.2.1. Phase I – Secondary Research
10.2.2. Phase II – Primary Research
10.2.3. Phase III – Expert Panel Review
10.2.4. Approach Adopted
10.2.4.1. Top-Down Approach
10.2.4.2. Bottom-Up Approach
10.2.5. Supply- Demand side
10.2.6. Breakup of the Primary Profiles


 Log in / Register


