Green chemicals, also known as bio-based chemicals, are the type of chemicals which does not have any adverse effect on the environment and human health as these chemicals are produced from bio-based feedstock & raw materials and are renewable in nature. These chemicals are less harmful as compared to the petroleum-based chemicals. The green chemical has a wide variety of application across industries namely automobile, construction, agriculture, food processing, and healthcare.
|
By Raw Material |
|
|
By Industry |
|
|
By Region |
|
The growth of this market is primarily driven by increasing concern towards maintaining an environmental balance and increasing government initiative to encourage the use of green chemicals. However, the high cost associated with the green chemicals and long manufacturing process and higher timelines for the intended application are likely to hamper the growth of the green chemical market during the forecast period. Also, according to a few research studies, some of the green chemicals contain dioxane, which is carcinogenic to nature. This might hamper the growth of the market to a certain extent.
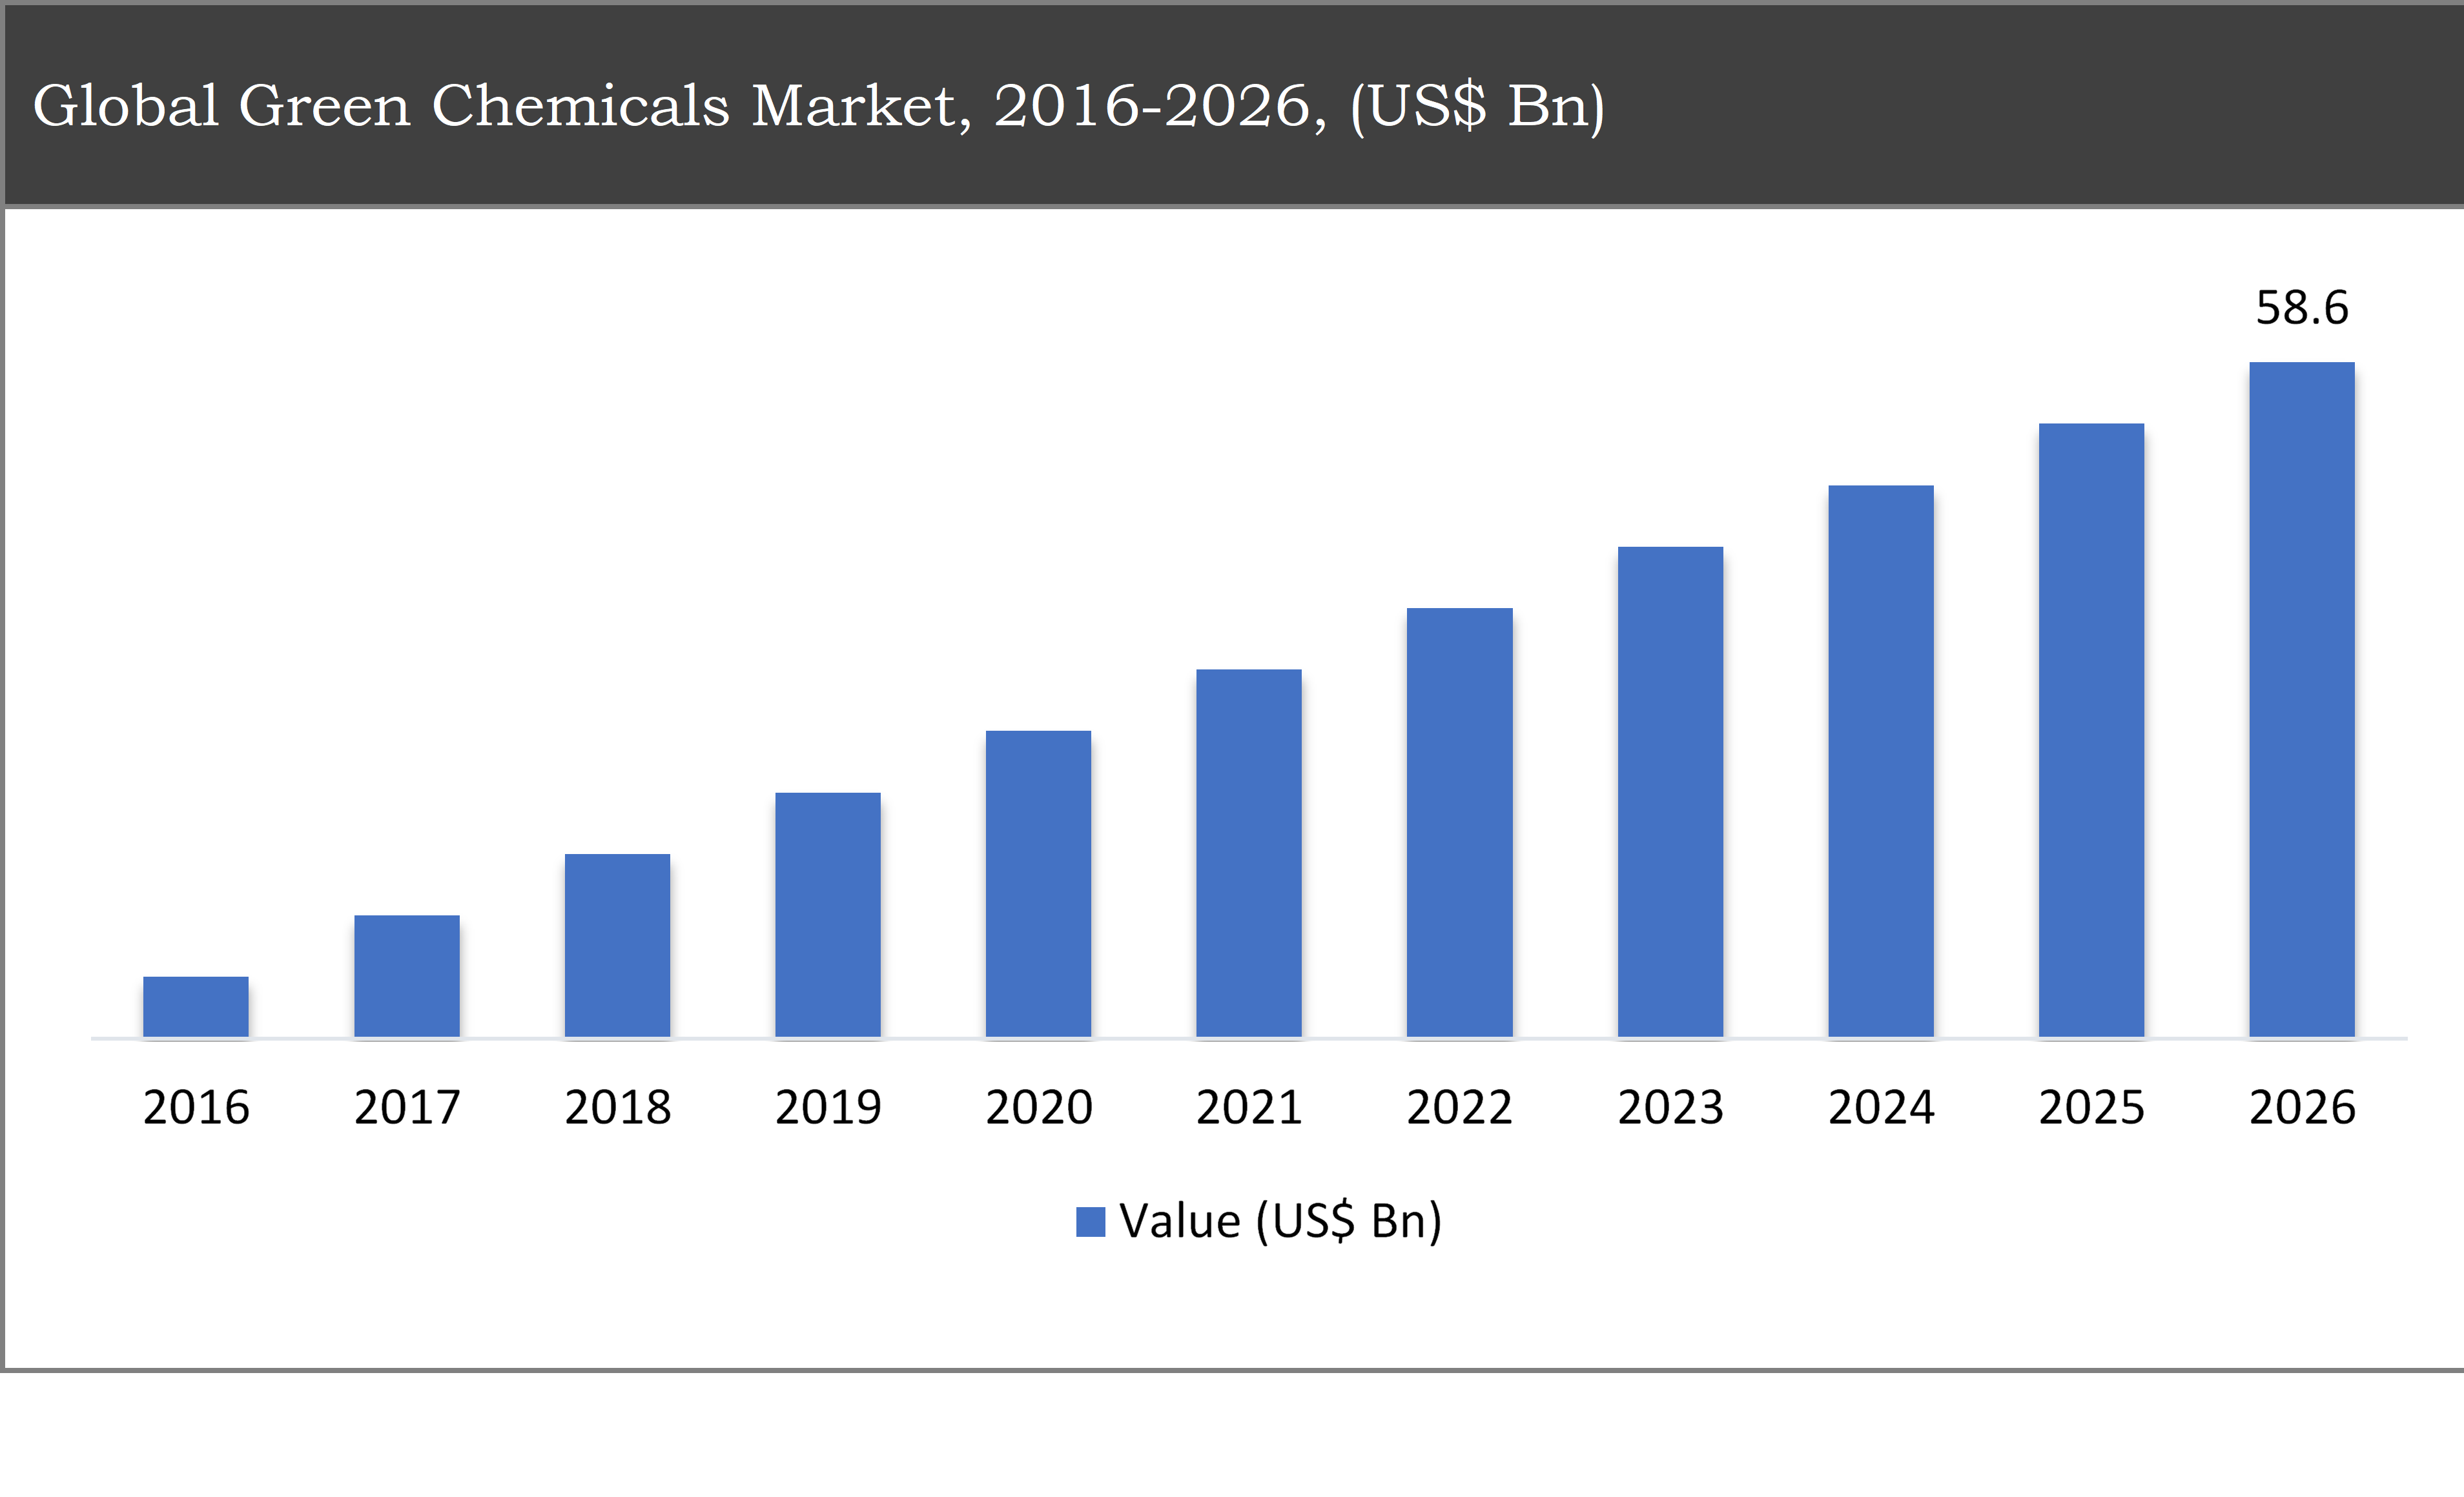
Global Green Chemicals Market, 2016-2026, (US$ Bn)
The bio ethanol segment expected to dominate the market throughout the forecast period
Based on the raw material type, the global green chemicals market has been segmented into bio-ethanol, sugar & starch, animal fats, Vegetable oil, and others. The bioethanol raw material segment accounted for the highest share in the global green chemicals market in 2018. The growth of this market is attributed to its usage in a wide verity of industries and eco-friendly nature.
Based on industry, the automobile industries segment is expected to grow at a highest CAGR throughout the forecast period
Based on industry, the market has been segmented into construction industry, healthcare industries, food processing industries, construction industries, automobiles industries, other industries. The construction industries industry segment accounts of the largest share in the market and are expected to grow at a steady pace throughout the forecast period. While the automobile industries industry segment is expected to register a fastest growing CAGR during the forecast period.
North America to dominate the green chemicals market throughout the forecast period
North America accounted for the largest market share nearly 40% of the global green chemicals market in 2018 and is expected to dominate the market throughout the forecast period. The growth is mainly attributed to the increasing demand for sustainable chemicals, higher adoption of green chemicals and the presence of key manufacturers in this region.
Asia Pacific is expected to register the highest CAGR in the global market during the forecast period. The growth of this segment is attributed to the growing awareness and control measures regarding environmental concerns, rapid industrialization and increasing government initiatives to promote the usage of green chemicals.
Company Profiles and Competitive Intelligence:
DuPont Industrial Biosciences, Cargill, Braskem, DSM, INESO group, BioAmber, BASF, Bayer Material Science AG, Anderson Corporation, and Balfour Beatty PLC among others are few of the key players in the green chemicals markets.

Ask for free product review call with the author

Share your specific research requirements for a customized report

Request for due diligence and consumer centric studies

Request for study updates, segment specific and country level reports
TABLE OF CONTENT
Chapter 1 Executive Summary
1.1. Market Summary
1.1.1. Global Green Chemicals Market, 2016-2026, (USD Million)
1.2. Market Snapshot: Global Green Chemicals Market
1.3. Market Dynamics
1.4. Global Green Chemicals Market, by Segment, 2018
1.4.1. Global Green Chemicals Market, by Raw Material, 2018, (USD Million)
1.4.2. Global Green Chemicals Market, by Industry, 2018, (USD Million)
1.4.3. Global Green Chemicals Market, by Region, 2018 (USD Million)
1.5. Premium Insights
1.5.1. Green Chemicals Market In Developed Vs. Developing Economies, 2018 vs 2023
1.5.2. Global Green Chemicals Market: Regional Life Cycle Analysis
Chapter 2 Market Dynamics
2.1. Market Overview
2.2. Market Drivers
2.2.1. Increasing concern towards maintaining an environmental balance
2.2.2. Increasing government initiative to encourage the use of green chemicals
2.3. Market Restraints
2.3.1. High cost associated with the green chemicals
2.3.2. Long manufacturing process and higher timelines for the intended application
2.4. Market Opportunities
2.4.1. Increase in concern for environmental safety
2.5. Industry Value Chain Analysis
2.6. Pricing Analysis
2.7. Porter’s Five Forces Analysis
Chapter 3 Global Green Chemicals Market, by Raw Material
3.1. Market Overview, by Raw Material
3.1.1. Global Green Chemicals Market, by Country, 2016-2026 (USD Million)
3.1.2. Incremental Opportunity, by Raw Material, 2018
3.2. Bio-Ethanol
3.2.1. Global Green Chemicals Market, by Bio-Ethanol, 2016-2026, (USD Million)
3.3. Sugar & Starch
3.3.1. Global Green Chemicals Market, by Sugar & Starch, 2016-2026, (USD Million)
3.4. Animal Fats
3.4.1. Global Green Chemicals Market, by Animal Fats, 2016-2026, (USD Million)
3.5. Vegetable Oils
3.5.1. Global Green Chemicals Market, by Vegetable Oils, 2016-2026, (USD Million)
3.6. Others
3.6.1. Global Green Chemicals Market, by Others, 2016-2026, (USD Million)
Chapter 4 Global Green Chemicals Market, by Industry
4.1. Market Overview, by Industry
4.1.1. Global Green Chemicals Market, by Industry, 2016-2026 (USD Million)
4.1.2. Incremental Opportunity, by Industry, 2018
4.2. Healthcare Industries
4.2.1. Global Green Chemicals Market, by Healthcare Industries, 2016-2026, (USD Million)
4.3. Food Processing Industries
4.3.1. Global Green Chemicals Market, by Food Processing Industries, 2016-2026, (USD Million)
4.4. Construction Industries
4.4.1. Global Green Chemicals Market, by Construction Industries, 2016-2026, (USD Million)
4.5. Automobiles Industries
4.5.1. Global Green Chemicals Market, by Automobiles Industries, 2016-2026, (USD Million)
4.6. Other Industries
4.6.1. Global Green Chemicals Market, by Other Industries, 2016-2026, (USD Million)
Chapter 5 Global Green Chemicals Market, by Region
5.1. Market Overview, by Region
5.1.1. Global Green Chemicals Market, by Region, 2016-2026, (USD Million)
5.2. Attractive Investment Opportunity, by Region, 2018
5.3. North America Green Chemicals Market
5.3.1. North America Green Chemicals Market, by Raw Material, 2016-2026 (USD Million)
5.3.2. North America Green Chemicals Market, by Industry, 2016-2026 (USD Million)
5.3.3. United States Green Chemicals Market, 2016-2026 (USD Million)
5.3.4. Canada Green Chemicals Market, 2016-2026 (USD Million)
5.4. Europe Green Chemicals Market
5.4.1. Europe Green Chemicals Market, by Raw Material, 2016-2026 (USD Million)
5.4.2. Europe Green Chemicals Market, by Industry, 2016-2026 (USD Million)
5.4.3. United Kingdom Green Chemicals Market, 2016-2026 (USD Million)
5.4.4. Germany Green Chemicals Market, 2016-2026 (USD Million)
5.4.5. France Green Chemicals Market, 2016-2026 (USD Million)
5.4.6. Rest of Europe Green Chemicals Market, 2016-2026 (USD Million)
5.5. Asia Pacific Green Chemicals Market
5.5.1. Asia Pacific Green Chemicals Market, by Raw Material, 2016-2026 (USD Million)
5.5.2. Asia Pacific Green Chemicals Market, by Industry, 2016-2026 (USD Million)
5.5.3. China Green Chemicals Market, 2016-2026 (USD Million)
5.5.4. Japan Green Chemicals Market, 2016-2026 (USD Million)
5.5.5. India Green Chemicals Market, 2016-2026 (USD Million)
5.5.6. Rest of Asia Pacific Green Chemicals Market, 2016-2026 (USD Million)
5.6. Latin America Green Chemicals Market
5.6.1. Latin America Green Chemicals Market, by Raw Material, 2016-2026 (USD Million)
5.6.2. Latin America Green Chemicals Market, by Industry, 2016-2026 (USD Million)
5.6.3. Brazil Green Chemicals Market, 2016-2026 (USD Million)
5.6.4. Mexico Green Chemicals Market, 2016-2026 (USD Million)
5.6.5. Rest of Latin America Green Chemicals Market, 2016-2026 (USD Million)
5.7. Middle East & Africa Green Chemicals Market
5.7.1. Middle East & Africa Green Chemicals Market, by Raw Material, 2016-2026 (USD Million)
5.7.2. Middle East & Africa Green Chemicals Market, by Industry, 2016-2026 (USD Million)
5.7.3. GCC Green Chemicals Market, 2016-2026 (USD Million)
5.7.4. Rest of Middle East & Africa Green Chemicals Market, 2016-2026 (USD Million)
Chapter 6 Competitive Intelligence
6.1. Top 5 Players Comparison
6.2. Market Positioning of Key Players, 2018
6.3. Market Players Mapping
6.3.1. By Raw Material
6.3.2. By Industry
6.3.3. By Region
6.4. Strategies Adopted by Key Market Players
6.5. Recent Developments in the Market
6.5.1. Mergers & Acquisitions, Partnership, New Raw Material Developments
Chapter 7 Company Profiles
7.1. DuPont Industrial Biosciences
7.1.1. DuPont Industrial Biosciences Overview
7.1.2. DuPont Industrial Biosciences Raw Materials Portfolio
7.1.3. DuPont Industrial Biosciences Financial Overview
7.1.4. DuPont Industrial Biosciences News/Recent Developments
7.2. Cargill
7.2.1. Cargill Overview
7.2.2. Cargill Raw Materials Portfolio
7.2.3. Cargill Financial Overview
7.2.4. Cargill News/Recent Developments
7.3. Braskem
7.3.1. Braskem Overview
7.3.2. Braskem Raw Materials Portfolio
7.3.3. Braskem Financial Overview
7.3.4. Braskem News/Recent Developments
7.4. DSM
7.4.1. DSM Overview
7.4.2. DSM Raw Materials Portfolio
7.4.3. DSM Financial Overview
7.4.4. DSM News/Recent Developments
7.5. INEOS Group
7.5.1. INEOS Group Overview
7.5.2. INEOS Group Raw Materials Portfolio
7.5.3. INEOS Group Financial Overview
7.5.4. INEOS Group News/Recent Developments
7.6. BioAmber
7.6.1. BioAmber Overview
7.6.2. BioAmber Raw Materials Portfolio
7.6.3. BioAmber Financial Overview
7.6.4. BioAmber News/Recent Developments
7.7. BASF
7.7.1. BASF Overview
7.7.2. BASF Raw Materials Portfolio
7.7.3. BASF Financial Overview
7.7.4. BASF News/Recent Developments
7.8. Bayer Material Science AG,
7.8.1. Bayer Material Science AG, Overview
7.8.2. Bayer Material Science AG, Raw Materials Portfolio
7.8.3. Bayer Material Science AG, Financial Overview
7.8.4. Bayer Material Science AG, News/Recent Developments
7.9. Anderson Corporation
7.9.1. Anderson Corporation Overview
7.9.2. Anderson Corporation Raw Materials Portfolio
7.9.3. Anderson Corporation Financial Overview
7.9.4. Anderson Corporation News/Recent Developments
7.10. Balfour Beatty PLC
7.10.1. Balfour Beatty PLC Overview
7.10.2. Balfour Beatty PLC Raw Materials Portfolio
7.10.3. Balfour Beatty PLC Financial Overview
7.10.4. Balfour Beatty PLC News/Recent Developments
Chapter 8 Preface
8.1. Data Triangulation
8.2. Research Methodology
8.2.1. Phase I – Secondary Research
8.2.2. Phase II – Primary Research
8.2.3. Phase III – Expert Panel Review
8.2.4. Approach Adopted
8.2.4.1. Top-Down Approach
8.2.4.2. Bottom-Up Approach
8.2.5. Supply- Demand side
8.2.6. Breakup of the Primary Profiles


 Log in / Register


