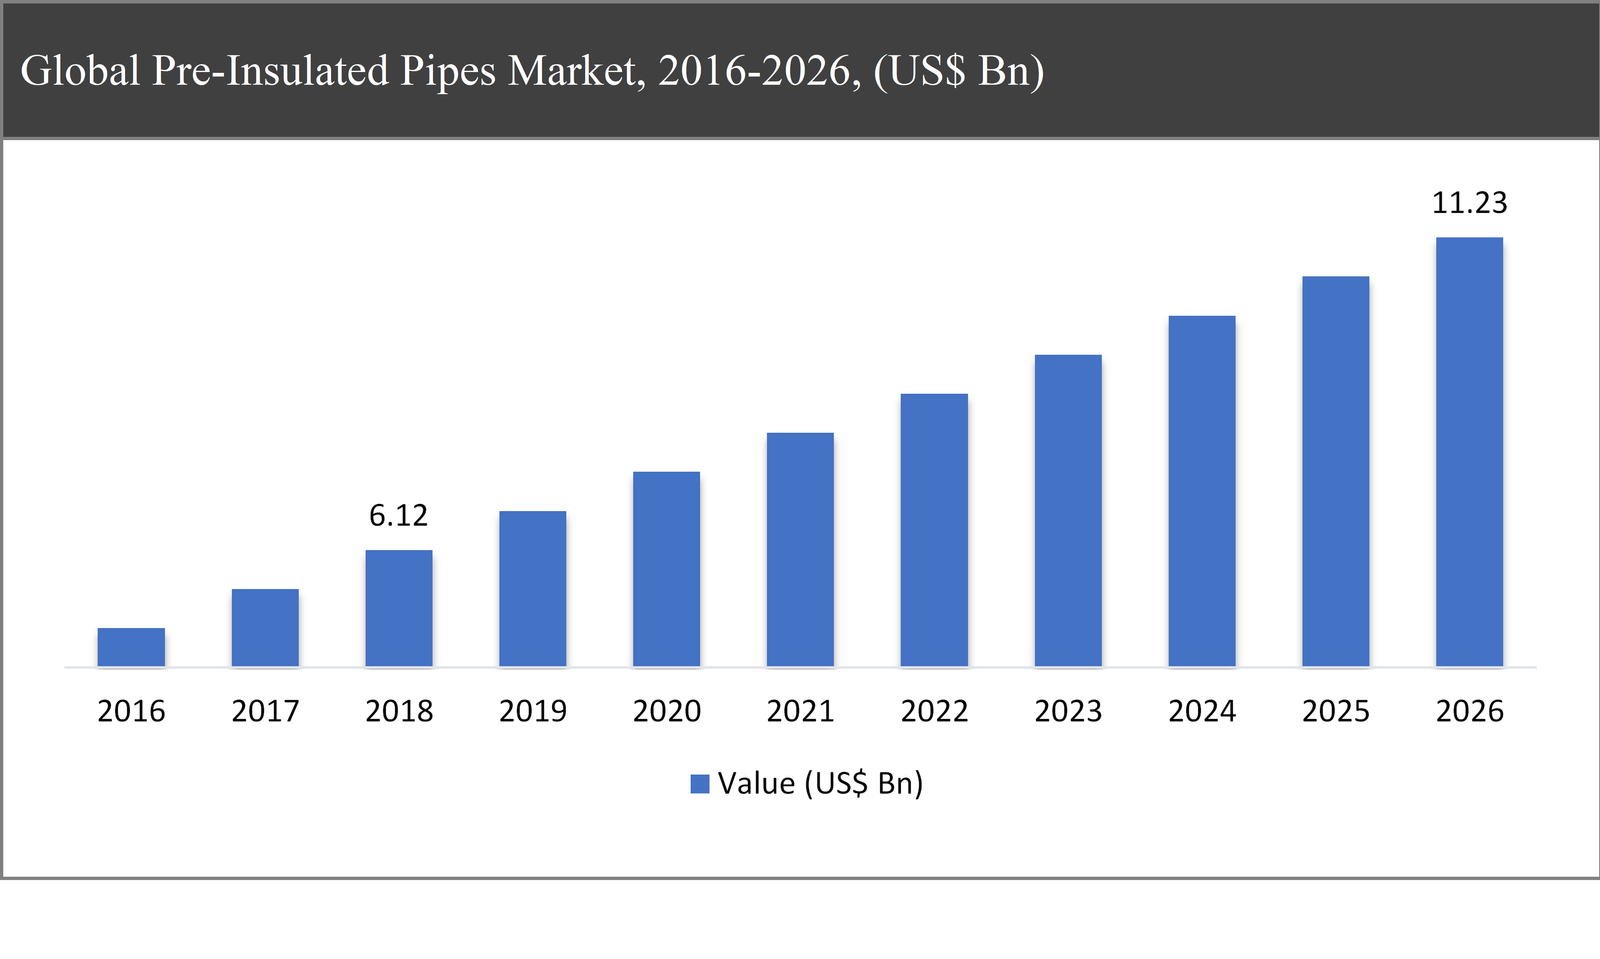
The global pre-insulated pipes market was valued at USD 6.12 billion in 2018 and is expected to reach USD 11.23 billion in 2026, growing at a CAGR of 7.98% during the forecast period.
The pre-insulated pipe systems are widely used and adopted for the transportation of gases and liquids to the district heating and cooling. In North America and Europe, it is primarily used for hot water and district heating supply. The main purpose and aim of the pipes are used to maintain the temperature of the fluid and gas in the pipes. Polyurethane foam is the main insulating material for the pre-insulated pipes.
Pre-Insulated Pipes Market Segmentation |
|
| By Type | 1. Flexible Pre-Insulated Pipes |
| 2. Rigid Pre-Insulated Pipes | |
| By Installation | 1. Ground |
| 2. Above Ground | |
| By End-Use Industry | 1. District Heating & Cooling |
| 2. Oil & Gas | |
| 3. Infrastructure & Utility | |
| 4. Others | |
| By Region | 1. North America (US and Canada) |
| 2. Europe (UK, Germany, France and Rest of Europe) | |
| 3. Asia Pacific (China, Japan, India and Rest of Asia Pacific) | |
| 4. Latin America (Brazil, Mexico and Rest of Latin America) | |
| 5. Middle East & Africa (GCC and Rest of Middle East & Africa) | |
Increase adoption of pre-insulated pipes in niche applications and an increase in awareness about energy-efficient products are expected to primarily drive the growth of the global pre-insulated pipes market. Moreover, the growth in the investments in emerging countries owing to increase expansion positive demand for pre-insulated pipes in the end-use applications are further expected to create growth opportunities for the market during the forecast period.
However, the fluctuation in the raw materials prices of pre-insulated pipes and high cost associated with the manufacturing of pre-insulated pipes are expected to hinder the growth of the market in the coming years.
The rigid pre-insulated pipes segment expected to dominate the market throughout the forecast period
Based on the type, the global pre-insulated pipes market has been segmented into flexible pre-insulated pipes and rigid pre-insulated pipes. The rigid pre-insulated pipes segment are expected to hold for the 62% market share in the market and further estimated to dominant over the forecast period. While flexible pre-insulated pipes are predicted to account for the highest CAGR in the global pre-insulated pipes market in future.
Based on the installation, the ground installed pre-insulated pipe segment is expected to grow at a CAGR of around 9.7% throughout the forecast period
Based on the installation, the market has been segmented into the ground and above ground. The ground installed pre-insulated pipe segment accounts of the largest share in the market and are expected to grow at a CAGR of around 9.7% during the forecast period.
Based on the end-use industry, the district heating & cooling segment is expected to dominate during the forecast period
Based on the end-use industry, the market has been segmented into district heating & cooling, oil & gas, infrastructure & utility, and other. In 2018, the district heating & cooling segment accounts of the largest share in the market in the global pre-insulated pipes market owing to increase in demand for comfort in the developed highly cold countries such as the US, Canada, the UK, Russia, and Germany.
Europe to dominate the pre-insulated pipes market throughout the forecast period
In terms of volume and value, Europe accounted for the highest market share of almost 43% share in the global pre-insulated pipes market in 2018. The region is expected to increase investment to increase the expansion of installation of pre-insulated pipes to meet the demand for district heating & cooling. Moreover, the increase in demand for energy-efficient solutions and further growth in the initiatives to minimize the impact of greenhouse gas emissions in the region are expected to further strengthen the growth of the market in the region over the forecast period.
Asia-Pacific is expected to hold the highest CAGR in the global market during the forecast period owing to the increase in the investment from the countries like China and India across the public and private sector to boost the oil & gas industry.
Company Profiles and Competitive Intelligence:
The major players operating in the global pre-insulated pipes market are Georg Fischer AG (Switzerland), Logstor (Denmark), Uponor Corporation (Finland), Watts Water Technologies (US), Perma-Pipe International Holdings (US), KE KELIT Austria, KC Polymers Pvt Ltd, Kabelwerke Brugg (Switzerland), Polypipe Group PLC (UK), and Isoplus Fernwaermetechnik GmbH (Germany) among others.

Ask for free product review call with the author

Share your specific research requirements for a customized report

Request for due diligence and consumer centric studies

Request for study updates, segment specific and country level reports
Chapter 1 Executive Summary
1.1. Market Summary
1.1.1. Global Pre-Insulated Pipes Market, 2016-2026, (USD Million)
1.2. Market Snapshot: Global Pre-Insulated Pipes Market
1.3. Market Dynamics
1.4. Global Pre-Insulated Pipes Market, by Segment, 2018
1.4.1. Global Pre-Insulated Pipes Market, by Type, 2018, (USD Million)
1.4.2. Global Pre-Insulated Pipes Market, by Installation, 2018, (USD Million)
1.4.3. Global Pre-Insulated Pipes Market, by End-Use Industry, 2018, (USD Million)
1.4.4. Global Pre-Insulated Pipes Market, by Region, 2018 (USD Million)
1.5. Premium Insights
1.5.1. Pre-Insulated Pipes Market In Developed Vs. Developing Economies, 2018 vs 2026
1.5.2. Global Pre-Insulated Pipes Market: Regional Life Cycle Analysis
Chapter 2 Market Dynamics
2.1. Market Overview
2.2. Market Drivers
2.2.1. Increase adoption of pre-insulated pipes in niche applications
2.2.2. Increase in awareness about energy-efficient products
2.3. Market Restraints
2.3.1. Fluctuation in the raw materials prices of pre-insulated pipes
2.3.2. High cost associated with the pre-insulated pipes
2.4. Market Opportunities
2.4.1. Investments in emerging economies
2.5. Industry Value Chain Analysis
2.6. Pricing Analysis
2.7. Porter’s Five Forces Analysis
Chapter 3 Global Pre-Insulated Pipes Market, by Type
3.1. Market Overview, by Type
3.1.1. Global Pre-Insulated Pipes Market, by type, 2016-2026 (USD Million)
3.1.2. Incremental Opportunity, by Type, 2018
3.2. Flexible Pre-Insulated Pipes
3.2.1. Global Pre-Insulated Pipes Market, by Flexible Pre-Insulated Pipes, 2016-2026, (USD Million)
3.3. Rigid Pre-Insulated Pipes
3.3.1. Global Pre-Insulated Pipes Market, by Rigid Pre-Insulated Pipes, 2016-2026, (USD Million)
Chapter 4 Global Pre-Insulated Pipes Market, by Installation
4.1. Market Overview, by Installation
4.1.1. Global Pre-Insulated Pipes Market, by Installation, 2016-2026 (USD Million)
4.1.2. Incremental Opportunity, by Installation, 2018
4.2. Ground
4.2.1. Global Pre-Insulated Pipes Market, by Ground, 2016-2026, (USD Million)
4.3. Above Ground
4.3.1. Global Pre-Insulated Pipes Market, by Above Ground, 2016-2026, (USD Million)
Chapter 5 Global Pre-Insulated Pipes Market, by End-Use Industry
5.1. Market Overview, by End-Use Industry
5.1.1. Global Pre-Insulated Pipes Market, by End-Use Industry, 2016-2026 (USD Million)
5.1.2. Incremental Opportunity, by End-Use Industry, 2018
5.2. District Heating & Cooling
5.2.1. Global Pre-Insulated Pipes Market, by District Heating & Cooling, 2016-2026, (USD Million)
5.3. Oil & Gas
5.3.1. Global Pre-Insulated Pipes Market, by Oil & Gas, 2016-2026, (USD Million)
5.4. Infrastructure & Utility
5.4.1. Global Pre-Insulated Pipes Market, by Infrastructure & Utility, 2016-2026, (USD Million)
5.5. Others
5.5.1. Global Pre-Insulated Pipes Market, by Others, 2016-2026, (USD Million)
Chapter 6 Global Pre-Insulated Pipes Market, by Region
6.1. Market Overview, by Region
6.1.1. Global Pre-Insulated Pipes Market, by Region, 2016-2026, (USD Million)
6.2. Attractive Investment Opportunity, by Region, 2018
6.3. North America Pre-Insulated Pipes Market
6.3.1. North America Pre-Insulated Pipes Market, by Type, 2016-2026 (USD Million)
6.3.2. North America Pre-Insulated Pipes Market, by Installation, 2016-2026 (USD Million)
6.3.3. North America Pre-Insulated Pipes Market, by End-Use Industry, 2016-2026 (USD Million)
6.3.4. United States Pre-Insulated Pipes Market, 2016-2026 (USD Million)
6.3.5. Canada Pre-Insulated Pipes Market, 2016-2026 (USD Million)
6.4. Europe Pre-Insulated Pipes Market
6.4.1. Europe Pre-Insulated Pipes Market, by Type, 2016-2026 (USD Million)
6.4.2. Europe Pre-Insulated Pipes Market, by Installation, 2016-2026 (USD Million)
6.4.3. Europe Pre-Insulated Pipes Market, by End-Use Industry, 2016-2026 (USD Million)
6.4.4. United Kingdom Pre-Insulated Pipes Market, 2016-2026 (USD Million)
6.4.5. Germany Pre-Insulated Pipes Market, 2016-2026 (USD Million)
6.4.6. France Pre-Insulated Pipes Market, 2016-2026 (USD Million)
6.4.7. Rest of Europe Pre-Insulated Pipes Market, 2016-2026 (USD Million)
6.5. Asia Pacific Pre-Insulated Pipes Market
6.5.1. Asia Pacific Pre-Insulated Pipes Market, by Type, 2016-2026 (USD Million)
6.5.2. Asia Pacific Pre-Insulated Pipes Market, by Installation, 2016-2026 (USD Million)
6.5.3. Asia Pacific Pre-Insulated Pipes Market, by End-Use Industry, 2016-2026 (USD Million)
6.5.4. China Pre-Insulated Pipes Market, 2016-2026 (USD Million)
6.5.5. Japan Pre-Insulated Pipes Market, 2016-2026 (USD Million)
6.5.6. India Pre-Insulated Pipes Market, 2016-2026 (USD Million)
6.5.7. Rest of Asia Pacific Pre-Insulated Pipes Market, 2016-2026 (USD Million)
6.6. Latin America Pre-Insulated Pipes Market
6.6.1. Latin America Pre-Insulated Pipes Market, by Type, 2016-2026 (USD Million)
6.6.2. Latin America Pre-Insulated Pipes Market, by Installation, 2016-2026 (USD Million)
6.6.3. Latin America Pre-Insulated Pipes Market, by End-Use Industry, 2016-2026 (USD Million)
6.6.4. Brazil Pre-Insulated Pipes Market, 2016-2026 (USD Million)
6.6.5. Mexico Pre-Insulated Pipes Market, 2016-2026 (USD Million)
6.6.6. Rest of Latin America Pre-Insulated Pipes Market, 2016-2026 (USD Million)
6.7. Middle East & Africa Pre-Insulated Pipes Market
6.7.1. Middle East & Africa Pre-Insulated Pipes Market, by Type, 2016-2026 (USD Million)
6.7.2. Middle East & Africa Pre-Insulated Pipes Market, by Installation, 2016-2026 (USD Million)
6.7.3. Middle East & Africa Pre-Insulated Pipes Market, by End-Use Industry, 2016-2026 (USD Million)
6.7.4. GCC Pre-Insulated Pipes Market, 2016-2026 (USD Million)
6.7.5. Rest of Middle East & Africa Pre-Insulated Pipes Market, 2016-2026 (USD Million)
Chapter 7 Competitive Intelligence
7.1. Top 5 Players Comparison
7.2. Market Positioning of Key Players, 2018
7.3. Market Players Mapping
7.3.1. By Type
7.3.2. By Installation
7.3.3. By End-Use Industry
7.3.4. By Region
7.4. Strategies Adopted by Key Market Players
7.5. Recent Developments in the Market
7.5.1. Mergers & Acquisitions, Partnership, New Product Developments
Chapter 8 Company Profiles
8.1. Georg Fischer AG
8.1.1. Georg Fischer AG Overview
8.1.2. Georg Fischer AG Products Portfolio
8.1.3. Georg Fischer AG Financial Overview
8.1.4. Georg Fischer AG News/Recent Developments
8.2. Logstor
8.2.1. Logstor Overview
8.2.2. Logstor Products Portfolio
8.2.3. Logstor Financial Overview
8.2.4. Logstor News/Recent Developments
8.3. Uponor Corporation
8.3.1. Uponor Corporation Overview
8.3.2. Uponor Corporation Products Portfolio
8.3.3. Uponor Corporation Financial Overview
8.3.4. Uponor Corporation News/Recent Developments
8.4. Watts Water Technologies
8.4.1. Watts Water Technologies Overview
8.4.2. Watts Water Technologies Products Portfolio
8.4.3. Watts Water Technologies Financial Overview
8.4.4. Watts Water Technologies News/Recent Developments
8.5. Perma-Pipe International Holdings
8.5.1. Perma-Pipe International Holdings Overview
8.5.2. Perma-Pipe International Holdings Products Portfolio
8.5.3. Perma-Pipe International Holdings Financial Overview
8.5.4. Perma-Pipe International Holdings News/Recent Developments
8.6. KE KELIT Austria
8.6.1. KE KELIT Austria Overview
8.6.2. KE KELIT Austria Products Portfolio
8.6.3. KE KELIT Austria Financial Overview
8.6.4. KE KELIT Austria News/Recent Developments
8.7. KC Polymers Pvt Ltd
8.7.1. KC Polymers Pvt Ltd Overview
8.7.2. KC Polymers Pvt Ltd Products Portfolio
8.7.3. KC Polymers Pvt Ltd Financial Overview
8.7.4. KC Polymers Pvt Ltd News/Recent Developments
8.8. Kabelwerke Brugg
8.8.1. Kabelwerke Brugg Overview
8.8.2. Kabelwerke Brugg Products Portfolio
8.8.3. Kabelwerke Brugg Financial Overview
8.8.4. Kabelwerke Brugg News/Recent Developments
8.9. Polypipe Group PLC
8.9.1. Polypipe Group PLC Overview
8.9.2. Polypipe Group PLC Products Portfolio
8.9.3. Polypipe Group PLC Financial Overview
8.9.4. Polypipe Group PLC News/Recent Developments
8.10. Isoplus Fernwaermetechnik GmbH
8.10.1. Isoplus Fernwaermetechnik GmbH Overview
8.10.2. Isoplus Fernwaermetechnik GmbH Products Portfolio
8.10.3. Isoplus Fernwaermetechnik GmbH Financial Overview
8.10.4. Isoplus Fernwaermetechnik GmbH News/Recent Developments
Chapter 9 Preface
9.1. Data Triangulation
9.2. Research Methodology
9.2.1. Phase I – Secondary Research
9.2.2. Phase II – Primary Research
9.2.3. Phase III – Expert Panel Review
9.2.4. Approach Adopted
9.2.4.1. Top-Down Approach
9.2.4.2. Bottom-Up Approach
9.2.5. Supply- Demand side
9.2.6. Breakup of the Primary Profiles


 Log in / Register


