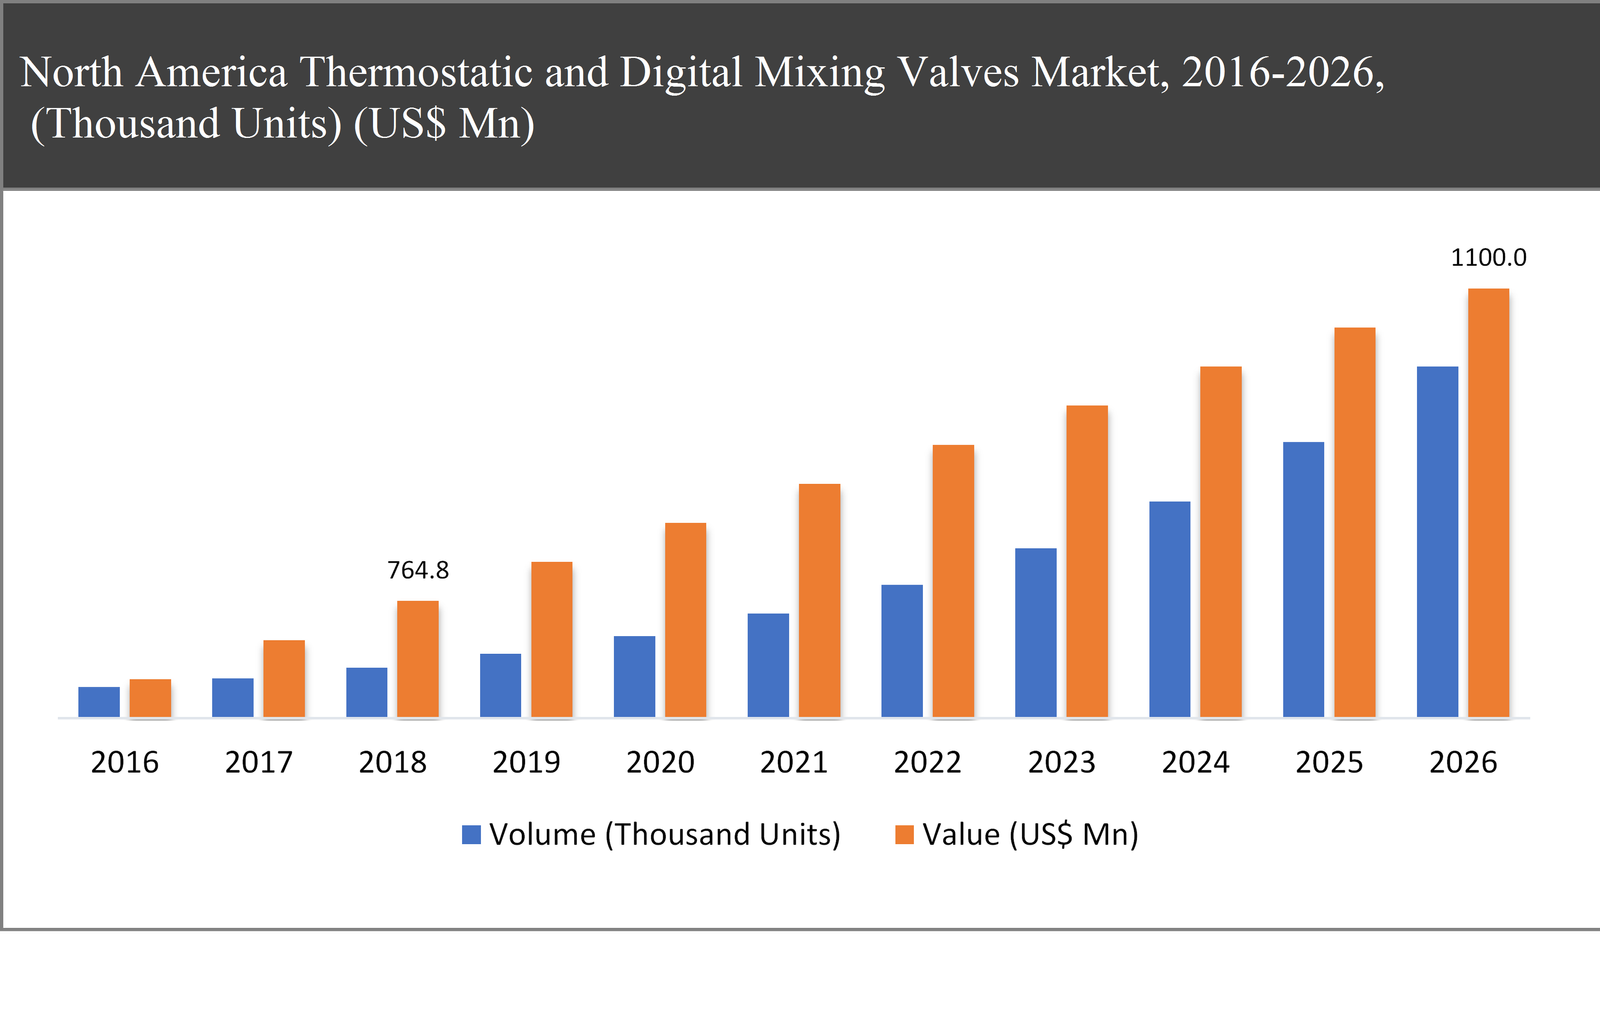
The thermostatic and digital mixing valves market in North America was valued at US$ 764.8 Mn in 2018 and is expected to reach US$ 1,260.4 Mn by the end of the forecast period, expanding at a CAGR of 6.7% during the forecast period.
Demand for thermostatic and digital mixing valve market in North America is primarily driven by the growing demand for smart plumbing in the region. Energy efficiency, convenience, and damage mitigation are some of the benefits offered by smart plumbing. In addition to this, IoT integration in thermostatic and digital mixing valves is another key factor that is positively impacting the growth of the market at present. IoT allows for a precise control over data related to water resources, thereby allowing for optimized water management. Key applications of smart water management include temperature monitoring to prevent accidental scalding and leakage detection, and water quality monitoring, among others.
Thermostatic and digital mixing valves Market Segmentation |
|
|
By Material |
|
|
By Product Type |
|
|
By Flow Rate |
|
|
By Communication Protocol |
|
|
By Standards |
|
|
By Applications |
|
|
By End-Users |
|
|
By Region |
|
Growing smart home penetration in the region is yet another factor that is supporting market growth of the thermostatic mixing valves in North America. In 2019, according to Consumer Technology Association (CTA), smart home penetration in the U.S. accounted for approximately 69%, or 22 Mn households. Demand for smart shower systems is on the rise in the region, which in turn, is supporting the market growth of thermostatic mixing valves in North America. The residential sector is expected to display a robust growth in the region in the coming years.
Bronze and Brass segment held the largest market share in the thermostatic and digital mixing valves market in 2018
Bronze is a metal alloy made from a combination of copper and tin, while brass is an alloy of copper and zinc, which make them strong and malleable. These properties help reduce the chances of cracks in valves. And these materials make valves corrosion resistant as well. The purity of the material used in manufacturing valves decide their price in the market. A brass valve is usually more expensive compared to pure bronze valves.
Due to high heat resistance and high melting points of bronze and brass valves, the demand for these valves is rising at a medium pace in the U.S market. The FDA does not approve brass valves unless they are certified as lead-free, making them a poor choice for use in the food industry (drinking water).
The thermostatic mixing valve segment held the largest market share in the year 2018
The thermostatic mixing valve is ideally designed to prevent accidental scalding and provide safety when using hot water by avoiding the risk of burn caused by a very high-water temperature. Thermostatic mixing valve uses sensitive sensor wax to allow users to set a desired temperature, ensuring maximum comfort, safety, and water and energy savings.
The demand for thermostatic mixing valves is derived from the increasing demand for water mixing operations in industrial units for enhanced water delivery systems. One of the major uses of thermostatic mixing valves is in solar systems to produce domestic hot water. In addition to these, the rising prevalence of Legionnaires’ disease and incidence of scalding in North America are expected to accelerate the market demand for thermostatic mixing valve
North America is dominating the global thermostatic and digital mixing valves market
U.S. is holed the largest market share in the North America thermostatic and digital mixing valves market in 2018. However, stringent regulations regarding the approval process for manufacturing creates challenges for market entrants.
Canada is the fastest-growing country in thermostatic and digital mixing valves during the forecast period owing to rising usage in residential sector and improving standards of living in developing economies. Moreover, rapidly expanding real estate sector and rising number of residential construction projects are expected to support the country’s growth.
The key players operating in the global thermostatic and digital mixing valves market includes Watts Water Technologies Inc., Armstrong International Inc., Acorn Engineering Company, Honeywell International Inc., Leonard Valves, Caleffi Hydronic Solutions, Bradley Corporation, Hughes Safety, Conbraco Industries, Inc. (Apollo Valves), Reliance Worldwide Corporation Limited, Zurn Industries LLC, Symmons Industries, Inc., Heat-Timer Corporation, among others.

Ask for free product review call with the author

Share your specific research requirements for a customized report

Request for due diligence and consumer centric studies

Request for study updates, segment specific and country level reports
Chapter 1 Research Scope
1.1 Market Segmentation Scope
1.2 Market Regional Scope
Chapter 2 Executive Summary
2.1 Market Summary
2.1 Market Snapshot: Global Thermostatic and Digital Mixing Valves Market
2.2 Market Dynamics (DRO)
2.3 Global Thermostatic and Digital Mixing Valves Market, by Segment, 2018
2.3.1 Global Thermostatic and Digital Mixing Valves Market, by Material, 2018, (Thousand Units) (US$ Mn)
2.3.2 Global Thermostatic and Digital Mixing Valves Market, by Product Type, 2018, (Thousand Units) (US$ Mn)
2.3.3 Global Thermostatic and Digital Mixing Valves Market, by Flow Rate, 2018,(Thousand Units) (US$ Mn)
2.3.4 Global Thermostatic and Digital Mixing Valves Market, by Communication Protocol, 2018,(Thousand Units) (US$ Mn)
2.3.5 Global Thermostatic and Digital Mixing Valves Market, by Standards, 2018,(Thousand Units) (US$ Mn)
2.3.6 Global Thermostatic and Digital Mixing Valves Market, by Applications, 2018,(Thousand Units) (US$ Mn)
2.3.7 Global Thermostatic and Digital Mixing Valves Market, by End-Users, 2018,(Thousand Units) (US$ Mn)
2.3.8 Global Thermostatic and Digital Mixing Valves Market, by Region, 2018 (Thousand Units) (US$ Mn)
2.4 Premium Insights
2.4.1 Key Trend and Impact Trajectory Growth
2.4.2 Brand Share Analysis
2.4.3 IoT Trends Impacting Digital Mixing Valves Business
2.4.4 Product Market Trends
2.4.5 Regulatory Implications & Approval Standards
2.4.6 Product Benchmarking
2.4.7 Competitive Benchmarking
2.4.8 Factors Impacting Buying Process
2.4.9 Developed Vs. Developing Economies, 2018 vs 2026
2.4.10 Regional Life Cycle Analysis
Chapter 3 Market Dynamics
3.1 Market Overview
3.2 Market Drivers
3.2.1 Rising prevalence of Legionnaires' disease across North America
3.2.2 Rising incidences of scalding across North America
3.2.3 Increased penetration of smart water handling systems
3.2.4 Increasing focus on reducing operating expenses of building & construction water systems
3.2.5 Increasing adoption of automation in building and construction end-use
3.3 Market Restraints
3.3.1 Presence of cryogenic environment
3.3.2 High lead time
3.3.3 Repair and maintenance cost associated with thermostatic and digital mixing valves
3.4 Market Opportunities
3.4.1 IoT integration
3.4.2 Functionality Augmentation
3.4.3 Smart Water Handling Systems
3.5 Market Threats
3.5.1 Changes in regulatory standards
3.5.2 Cost Margins
3.5.3 IoT integration
3.6 PORTER’s Analysis
3.7 Industry SWOT Analysis
Chapter 4 Global Thermostatic and Digital Mixing Valves Market, by Material
4.1 Market Overview, by Material
4.1.1 Incremental Opportunity, by Material, 2018-2026
4.2 Bronze and Brass
4.2.1 Global Thermostatic and Digital Mixing Valves Market, by Bronze and Brass, 2016-2026, (Thousand Units) (US$ Mn)
4.3 Stainless Steel
4.3.1 Global Thermostatic and Digital Mixing Valves Market, by Stainless Steel , 2016-2026, (Thousand Units) (US$ Mn)
4.4 Copper
4.4.1 Global Thermostatic and Digital Mixing Valves Market, by Copper, 2016-2026, (Thousand Units) (US$ Mn)
4.5 Thermoplastic
4.5.1 Global Thermostatic and Digital Mixing Valves Market, by Thermoplastic, 2016-2026, (Thousand Units) (US$ Mn)
4.6 Others
4.6.1 Global Thermostatic and Digital Mixing Valves Market, by Others , 2016-2026, (Thousand Units) (US$ Mn)
Chapter 5 Global Thermostatic and Digital Mixing Valves Market, by Product Type
5.1 Market Overview, by Product Type
5.1.1 Incremental Opportunity, by Product Type, 2018-2026
5.2 Thermostatic Mixing Valve
5.2.1 Global Thermostatic and Digital Mixing Valves Market, by Thermostatic Mixing Valve, 2016-2026, (Thousand Units) (US$ Mn)
5.3 Digital Mixing Valve
5.3.1 Global Thermostatic and Digital Mixing Valves Market, by Digital Mixing Valve, 2016-2026, (Thousand Units) (US$ Mn)
Chapter 6 Global Thermostatic and Digital Mixing Valves Market, by Flow Rate
6.1 Market Overview, by Flow Rate
6.1.1 Global Thermostatic and Digital Mixing Valves Market, by Flow Rate, 2016-2026 (Thousand Units) (US$ Mn)
6.1.2 Incremental Opportunity, by Flow Rate , 2018-2026
6.2 Less than 2 GPM
6.2.1 Global Thermostatic and Digital Mixing Valves Market, by Less than 2 GPM, 2016-2026, (Thousand Units) (US$ Mn)
6.3 2-20 GPM
6.3.1 Global Thermostatic and Digital Mixing Valves Market, by 2-20 GPM, 2016-2026 (Thousand Units) (US$ Mn)
6.4 21-38 GPM
6.4.1 Global Thermostatic and Digital Mixing Valves Market, by 21-38 GPM, 2016-2026 (Thousand Units) (US$ Mn)
6.5 Above 38 GPM
6.5.1 Global Thermostatic and Digital Mixing Valves Market, by Above 38 GPM, 2016-2026 (Thousand Units) (US$ Mn)
Chapter 7 Global Thermostatic and Digital Mixing Valves Market, by Communication Protocol
7.1 Market Overview, by Communication Protocol
7.1.1 Global Thermostatic and Digital Mixing Valves Market, by Communication Protocol , 2016-2026 (Thousand Units) (US$ Mn)
7.1.2 Incremental Opportunity, by Communication Protocol, 2018-2026
7.2 BACnet
7.2.1 Global Thermostatic and Digital Mixing Valves Market, by BACnet, 2016-2026, (Thousand Units) (US$ Mn)
7.3 Modbus
7.3.1 Global Thermostatic and Digital Mixing Valves Market, by Modbus, 2016-2026, (Thousand Units) (US$ Mn)
7.4 Wi-Fi
7.4.1 Global Thermostatic and Digital Mixing Valves Market, by Wi-Fi, 2016-2026, (Thousand Units) (US$ Mn)
7.5 Others
7.5.1 Global Thermostatic and Digital Mixing Valves Market, by Others, 2016-2026, (Thousand Units) (US$ Mn)
Chapter 8 Global Thermostatic and Digital Mixing Valves Market, by Communication Protocol
8.1 Market Overview, by Communication Protocol
8.1.1 Global Thermostatic and Digital Mixing Valves Market, by Communication Protocol , 2016-2026 (Thousand Units) (US$ Mn)
8.1.2 Incremental Opportunity, by Communication Protocol, 2018-2026
8.2 BACnet
8.2.1 Global Thermostatic and Digital Mixing Valves Market, by BACnet, 2016-2026, (Thousand Units) (US$ Mn)
8.3 Modbus
8.3.1 Global Thermostatic and Digital Mixing Valves Market, by Modbus, 2016-2026, (Thousand Units) (US$ Mn)
8.4 Wi-Fi
8.4.1 Global Thermostatic and Digital Mixing Valves Market, by Wi-Fi, 2016-2026, (Thousand Units) (US$ Mn)
8.5 Others
8.5.1 Global Thermostatic and Digital Mixing Valves Market, by Others, 2016-2026, (Thousand Units) (US$ Mn)
Chapter 9 Global Thermostatic and Digital Mixing Valves Market, by Standards
9.1 Market Overview, by Standards
9.1.1 Global Thermostatic and Digital Mixing Valves Market, by Standards, 2016-2026 (Thousand Units) (US$ Mn)
9.1.2 Incremental Opportunity, by Standards, 2018-2026
9.2 ASSE 1017
9.2.1 Global Thermostatic and Digital Mixing Valves Market, by ASSE 1017, 2016-2026, (Thousand Units) (US$ Mn)
9.3 ASSE 1016
9.3.1 Global Thermostatic and Digital Mixing Valves Market, by ASSE 1016, 2016-2026, (Thousand Units) (US$ Mn)
9.4 ASSE 1069
9.4.1 Global Thermostatic and Digital Mixing Valves Market, by ASSE 1069, 2016-2026, (Thousand Units) (US$ Mn)
9.5 ASSE 1070
9.5.1 Global Thermostatic and Digital Mixing Valves Market, by ASSE 1070, 2016-2026, (Thousand Units) (US$ Mn)
9.6 ASSE 1071
9.6.1 Global Thermostatic and Digital Mixing Valves Market, by ASSE 1071, 2016-2026, (Thousand Units) (US$ Mn)
9.7 CSA
9.7.1 Global Thermostatic and Digital Mixing Valves Market, by CSA, 2016-2026, (Thousand Units) (US$ Mn)
Chapter 10 Global Thermostatic and Digital Mixing Valves Market, by Applications
10.1 Market Overview, by Applications
10.1.1 Global Thermostatic and Digital Mixing Valves Market, by Applications, 2016-2026 (Thousand Units) (US$ Mn)
10.1.2 Incremental Opportunity, by Applications, 2018-2026
10.2 HVAC
10.2.1 Global Thermostatic and Digital Mixing Valves Market, by HVAC, 2016-2026, (Thousand Units) (US$ Mn)
10.3 Space Heating
10.3.1 Global Thermostatic and Digital Mixing Valves Market, by Space Heating, 2016-2026, (Thousand Units) (US$ Mn)
10.4 Heat Pump Systems
10.4.1 Global Thermostatic and Digital Mixing Valves Market, by Heat Pump Systems, 2016-2026, (Thousand Units) (US$ Mn)
10.5 Bathing Systems
10.5.1 Global Thermostatic and Digital Mixing Valves Market, by Bathing Systems, 2016-2026, (Thousand Units) (US$ Mn)
10.6 Hot/Cold Water Distribution
10.6.1 Global Thermostatic and Digital Mixing Valves Market, by Hot/Cold Water Distribution, 2016-2026, (Thousand Units) (US$ Mn)
10.7 Others
10.7.1 Global Thermostatic and Digital Mixing Valves Market, by Others, 2016-2026, (Thousand Units) (US$ Mn)
Chapter 11 Global Thermostatic and Digital Mixing Valves Market, by End Users
11.1 Market Overview, by End Users
11.1.1 Global Thermostatic and Digital Mixing Valves Market, by End Users, 2016-2026 (Thousand Units) (US$ Mn)
11.1.2 Incremental Opportunity, by End Users, 2018-2026
11.2 Residential
11.2.1 Global Thermostatic and Digital Mixing Valves Market, by Residential, 2016-2026, (Thousand Units) (US$ Mn)
11.3 Commercials and Institutions
11.3.1 Global Thermostatic and Digital Mixing Valves Market, by Commercials and Institutions, 2016-2026, (Thousand Units) (US$ Mn)
11.4 Industrial
11.4.1 Global Thermostatic and Digital Mixing Valves Market, by Industrial, 2016-2026, (Thousand Units) (US$ Mn)
Chapter 12 Global Thermostatic and Digital Mixing Valves Market, by Region
12.1 Market Overview, by Region
12.1.1 Global Thermostatic and Digital Mixing Valves Market, by Region, 2016-2026, (Thousand Units
12.1.2 Global Thermostatic and Digital Mixing Valves Market, by Region, 2016-2026, (US$ Mn)
12.2 Attractive Investment Opportunity, by Region, 2018
12.3 North America Thermostatic and Digital Mixing Valves Market
12.3.1 North America Thermostatic and Digital Mixing Valves Market, by Material, 2016-2026 (Thousand Units) (US$ Mn)
12.3.2 North America Thermostatic and Digital Mixing Valves Market, by Product Type, 2016-2026 (Thousand Units) (US$ Mn)
12.3.3 North America Thermostatic and Digital Mixing Valves Market, by Flow Rate , 2016-2026 (Thousand Units) (US$ Mn)
12.3.4 North America Thermostatic and Digital Mixing Valves Market, by Communication Protocol , 2016-2026 (Thousand Units) (US$ Mn)
12.3.1 North America Thermostatic and Digital Mixing Valves Market, by Standards, 2016-2026 (Thousand Units) (US$ Mn)
12.3.2 North America Thermostatic and Digital Mixing Valves Market, by Applications, 2016-2026 (Thousand Units) (US$ Mn)
12.3.3 North America Thermostatic and Digital Mixing Valves Market, by End Users, 2016-2026 (Thousand Units) (US$ Mn)
12.3.4 North America Thermostatic and Digital Mixing Valves Market, by Country, 2016-2026 (Thousand Units) (US$ Mn)
12.3.5 North America Thermostatic and Digital Mixing Valves Market, by Country, 2016-2026, (Thousand Units) (US$ Mn)
12.3.5.1 U.S.
12.3.5.2 Canada
12.4 Europe Thermostatic and Digital Mixing Valves Market
12.4.1 Europe Thermostatic and Digital Mixing Valves Market, by Material, 2016-2026 (Thousand Units) (US$ Mn)
12.4.2 Europe Thermostatic and Digital Mixing Valves Market, by Product Type, 2016-2026 (Thousand Units) (US$ Mn)
12.4.3 Europe Thermostatic and Digital Mixing Valves Market, by Flow Rate, 2016-2026 (Thousand Units) (US$ Mn)
12.4.4 Europe Thermostatic and Digital Mixing Valves Market, by Communication Protocol, 2016-2026 (Thousand Units) (US$ Mn)
12.4.5 Europe Thermostatic and Digital Mixing Valves Market, by Standards, 2016-2026 (Thousand Units) (US$ Mn)
12.4.6 Europe Thermostatic and Digital Mixing Valves Market, by Applications, 2016-2026 (Thousand Units) (US$ Mn)
12.4.7 Europe Thermostatic and Digital Mixing Valves Market, by End Users, 2016-2026 (Thousand Units) (US$ Mn)
12.4.8 Europe Thermostatic and Digital Mixing Valves Market, by Country, 2016-2026 (Thousand Units) (US$ Mn)
12.4.9 Europe Thermostatic and Digital Mixing Valves Market, by Country, 2016-2026, (Thousand Units) (US$ Mn)
12.4.9.1 U.K.
12.4.9.2 Germany
12.4.9.3 France
12.4.9.4 Rest of Europe
12.5 Asia Pacific Thermostatic and Digital Mixing Valves Market
12.5.1 Asia Pacific Thermostatic and Digital Mixing Valves Market, by Material, 2016-2026 (Thousand Units) (US$ Mn)
12.5.2 Asia Pacific Thermostatic and Digital Mixing Valves Market, by Product Type, 2016-2026 (Thousand Units) (US$ Mn)
12.5.3 Asia Pacific Thermostatic and Digital Mixing Valves Market, by Flow Rate, 2016-2026 (Thousand Units) (US$ Mn)
12.5.4 Asia Pacific Thermostatic and Digital Mixing Valves Market, by Communication Protocol , 2016-2026 (Thousand Units) (US$ Mn)
12.5.5 Asia Pacific Thermostatic and Digital Mixing Valves Market, by Standards, 2016-2026 (Thousand Units) (US$ Mn)
12.5.6 Asia Pacific Thermostatic and Digital Mixing Valves Market, by Applications, 2016-2026 (Thousand Units) (US$ Mn)
12.5.7 Asia Pacific Thermostatic and Digital Mixing Valves Market, by End Users, 2016-2026 (Thousand Units) (US$ Mn)
12.5.8 Asia Pacific Thermostatic and Digital Mixing Valves Market, by Country, 2016-2026 (Thousand Units) (US$ Mn)
12.5.9 Asia Pacific Thermostatic and Digital Mixing Valves Market, by Country, 2016-2026, (Thousand Units) (US$ Mn)
12.5.9.1 India
12.5.9.2 China
12.5.9.3 Japan
12.5.9.4 Rest of Asia Pacific
12.6 Latin America Thermostatic and Digital Mixing Valves Market
12.6.1 Latin America Thermostatic and Digital Mixing Valves Market, by Material, 2016-2026 (Thousand Units) (US$ Mn)
12.6.2 Latin America Thermostatic and Digital Mixing Valves Market, by Product Type, 2016-2026 (Thousand Units) (US$ Mn)
12.6.3 Latin America Thermostatic and Digital Mixing Valves Market, by Flow Rate, 2016-2026 (Thousand Units) (US$ Mn)
12.6.4 Latin America Thermostatic and Digital Mixing Valves Market, by Communication Protocol , 2016-2026 (Thousand Units) (US$ Mn)
12.6.5 Latin America Thermostatic and Digital Mixing Valves Market, by Standards, 2016-2026 (Thousand Units) (US$ Mn)
12.6.6 Latin America Thermostatic and Digital Mixing Valves Market, by Applications, 2016-2026 (Thousand Units) (US$ Mn)
12.6.7 Latin America Thermostatic and Digital Mixing Valves Market, by End Users, 2016-2026 (Thousand Units) (US$ Mn)
12.6.8 Latin America Thermostatic and Digital Mixing Valves Market, by Country, 2016-2026 (Thousand Units) (US$ Mn)
12.6.9 Latin America Thermostatic and Digital Mixing Valves Market, by Country, 2016-2026, (Thousand Units) (US$ Mn)
12.6.9.1 Brazil
12.6.9.2 Mexico
12.6.9.3 Rest of Latin America
12.7 Middle East & Africa Thermostatic and Digital Mixing Valves Market
12.7.1 Middle East & Africa Thermostatic and Digital Mixing Valves Market, by Material, 2016-2026 (Thousand Units) (US$ Mn)
12.7.2 Middle East & Africa Thermostatic and Digital Mixing Valves Market, by Product Type, 2016-2026 (Thousand Units) (US$ Mn)
12.7.3 Middle East & Africa Thermostatic and Digital Mixing Valves Market, by Flow Rate, 2016-2026 (Thousand Units) (US$ Mn)
12.7.4 Middle East & Africa Thermostatic and Digital Mixing Valves Market, by Communication Protocol, 2016-2026 (Thousand Units) (US$ Mn)
12.7.5 Middle East & Africa Thermostatic and Digital Mixing Valves Market, by Standards, 2016-2026 (Thousand Units) (US$ Mn)
12.7.6 Middle East & Africa Thermostatic and Digital Mixing Valves Market, by Applications, 2016-2026 (Thousand Units) (US$ Mn)
12.7.7 Middle East & Africa Thermostatic and Digital Mixing Valves Market, by End Users, 2016-2026 (Thousand Units) (US$ Mn)
12.7.8 Middle East & Africa Thermostatic and Digital Mixing Valves Market, by Region, 2016-2026 (Thousand Units) (US$ Mn)
12.7.9 Middle East & Africa Thermostatic and Digital Mixing Valves Market, by Region/Country, 2016-2026, (Thousand Units) (US$ Mn)
12.7.9.1 GCC
12.7.9.2 Rest of Middle East & Africa
Chapter 13 Competitive Intelligence
13.1 Overview
13.2 Market Share Analysis of key players, 2018
13.3 Market Players Present in Market Life Cycle
13.4 Top Players Comparison
13.5 Market Positioning of Key Players, 2018
13.6 Market Players Mapping
13.6.1 By Material
13.6.2 By Product Type
13.6.1 By Flow Rate
13.6.2 By Communication Protocol
13.6.3 By Standards
13.6.4 By Applications
13.6.5 By End Users
13.6.6 By Region
13.7 Strategies Adopted by Key Market Players
13.8 Recent Developments in the Market
13.8.1 Mergers & Acquisitions, Partnership, New Product Developments
Chapter 14 Company Profiles
14.1 Watts Water Technologies Inc.
14.1.1 Watts Water Technologies Inc. Overview
14.1.2 Key Stakeholders/Person in Watts Water Technologies Inc.
14.1.3 Watts Water Technologies Inc. Products Portfolio
14.1.4 Watts Water Technologies Inc. Financial Overview
14.1.5 Watts Water Technologies Inc. News/Recent Developments
14.1.6 Watts Water Technologies Inc. SWOT Analysis
14.1.7 Analyst Views
14.2 Armstrong International Inc.
14.2.1 Armstrong International Inc. Overview
14.2.2 Key Stakeholders/Person in Armstrong International Inc.
14.2.3 Armstrong International Inc. Products Portfolio
14.2.4 Armstrong International Inc. Financial Overview
14.2.5 Armstrong International Inc. News/Recent Developments
14.2.6 Armstrong International Inc. SWOT Analysis
14.2.7 Analyst View
14.3 Acorn Engineering Company
14.3.1 Acorn Engineering Company Overview
14.3.2 Key Stakeholders/Person in Acorn Engineering Company
14.3.3 Acorn Engineering Company Products Portfolio
14.3.4 Acorn Engineering Company Financial Overview
14.3.5 Acorn Engineering Company News/Recent Developments
14.3.6 Acorn Engineering Company SWOT Analysis
14.3.7 Analyst View
14.4 Honeywell International Inc.
14.4.1 Honeywell International Inc. Overview
14.4.2 Key Stakeholders/Person in Honeywell International Inc.
14.4.3 Honeywell International Inc. Products Portfolio
14.4.4 Honeywell International Inc. Financial Overview
14.4.5 Honeywell International Inc. News/Recent Developments
14.4.6 Honeywell International Inc. SWOT Analysis
14.4.7 Analyst View
14.5 Leonard Valves, Digital (Nucleus and Proton brands)
14.5.1 Leonard Valves, Digital (Nucleus and Proton brands) Overview
14.5.2 Key Stakeholders/Person in Leonard Valves, Digital (Nucleus and Proton brands)
14.5.3 Leonard Valves, Digital (Nucleus and Proton brands) Products Portfolio
14.5.4 Leonard Valves, Digital (Nucleus and Proton brands) Financial Overview
14.5.5 Leonard Valves, Digital (Nucleus and Proton brands) News/Recent Developments
14.5.6 Leonard Valves, Digital (Nucleus and Proton brands) SWOT Analysis
14.5.7 Analyst View
14.6 Caleffi Hydronic Solutions
14.6.1 Caleffi Hydronic Solutions Overview
14.6.2 Key Stakeholders/Person in Caleffi Hydronic Solutions
14.6.3 Caleffi Hydronic Solutions Products Portfolio
14.6.4 Caleffi Hydronic Solutions Financial Overview
14.6.5 Caleffi Hydronic Solutions News/Recent Developments
14.6.6 Caleffi Hydronic Solutions SWOT Analysis
14.6.7 Analyst View
14.7 Bradley Corporation
14.7.1 Bradley Corporation Overview
14.7.2 Key Stakeholders/Person in Bradley Corporation
14.7.3 Bradley Corporation Products Portfolio
14.7.4 Bradley Corporation Financial Overview
14.7.5 Bradley Corporation News/Recent Developments
14.7.6 Bradley Corporation SWOT Analysis
14.7.7 Analyst View
14.8 Hughes Safety
14.8.1 Hughes Safety Overview
14.8.2 Key Stakeholders/Person in Hughes Safety
14.8.3 Hughes Safety Products Portfolio
14.8.4 Hughes Safety Financial Overview
14.8.5 Hughes Safety News/Recent Developments
14.8.6 Hughes Safety SWOT Analysis
14.8.7 Analyst View
14.9 Apollo Valves
14.9.1 Apollo Valves Overview
14.9.2 Key Stakeholders/Person in Apollo Valves
14.9.3 Apollo Valves Products Portfolio
14.9.4 Apollo Valves Financial Overview
14.9.5 Apollo Valves News/Recent Developments
14.9.6 Apollo Valves SWOT Analysis
14.9.7 Analyst View
14.10 Reliance Water Control Ltd.
14.10.1 Reliance Water Control Ltd. Overview
14.10.2 Key Stakeholders/Person in Reliance Water Control Ltd.
14.10.3 Reliance Water Control Ltd. Products Portfolio
14.10.4 Reliance Water Control Ltd. Financial Overview
14.10.5 Reliance Water Control Ltd. News/Recent Developments
14.10.6 Reliance Water Control Ltd. SWOT Analysis
14.10.7 Analyst View
Chapter 15 Research Methodology
15.1 Methodology/Research Approach
15.2 Market Size Estimation
15.3 Data Source
15.3.1 Secondary Sources
15.3.2 Primary Sources
15.4 Breakup of the Primary Profiles


 Log in / Register


