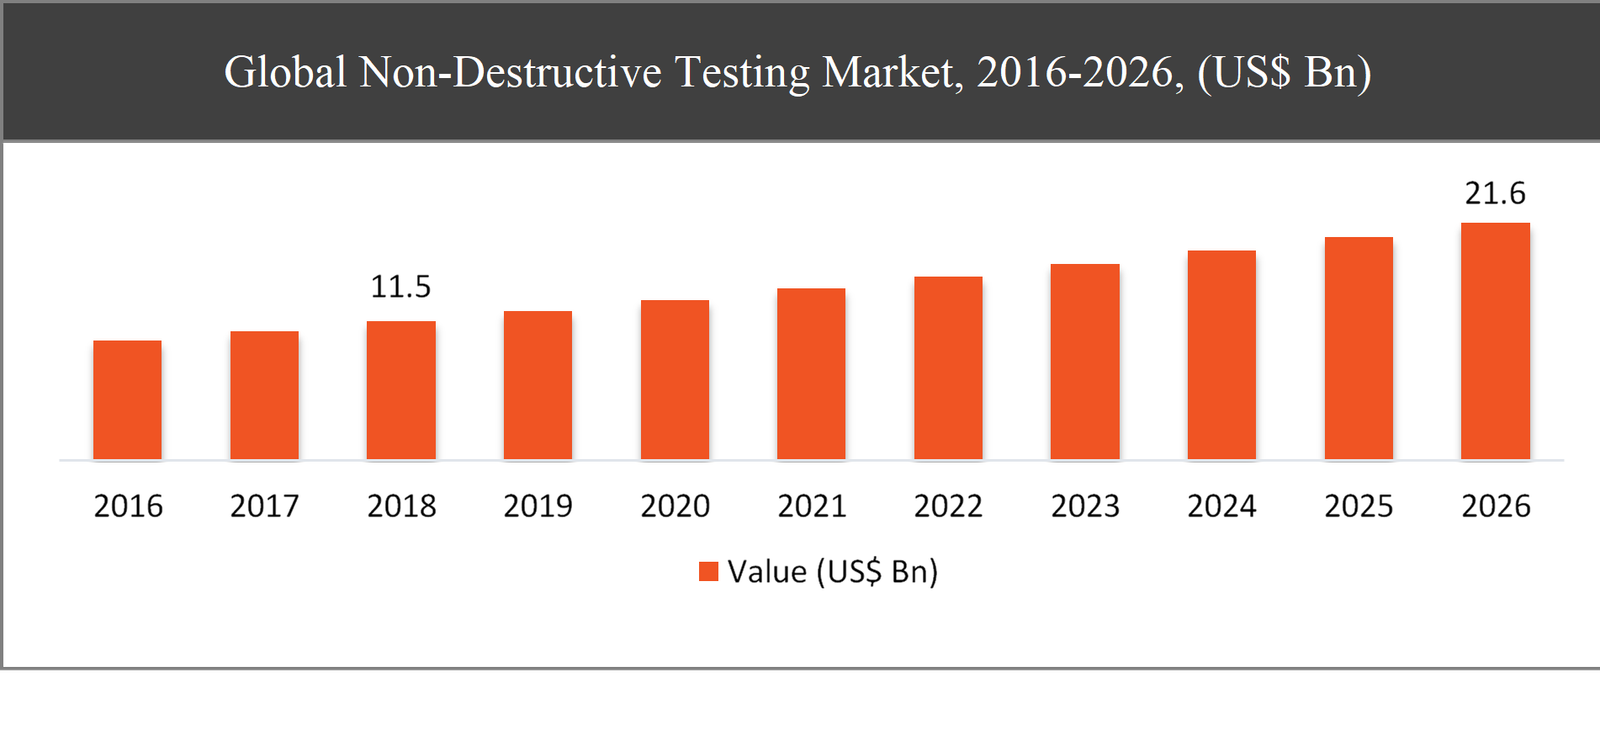
The global non-destructive testing market was valued at USD 11.5 billion in 2018 and is expected to reach USD 21.6 billion in 2026, growing at a CAGR of 8.2% during the forecast period.
Non-destructive testing (NDT) or Non-destructive evaluation (NDE) refers to techniques, which are used to detect, locate and assess defects or flaws in materials or structures or fabricated components without affecting their continued usefulness or serviceability. This important and growing industry is involved in applying these proven techniques and procedures to the full range of engineering structures.
Constant advancements in electronics, robotics, and automation; easy to use software; assured return on investments; and favorable government regulations, among more are some of the major factors driving the growth of the non-destructive testing market. However, the complexity of the equipment makes it hard to operate and is costly, which could hamper the market growth. Lack of product knowledge in end users and high initial costs could also restrain the market growth.
Non-Destructive Testing Market Segmentation |
|
| By Type | 1. Visual Testing |
| 2. Magnetic Particle Testing | |
| 3. Liquid Penetrant Testing | |
| 4. Radiography Testing | |
| 5. Ultrasonic Testing | |
| 6. Eddy Current Testing | |
| By Industry Vertical | 1. Oil & Gas |
| 2. Aerospace & Defense | |
| 3. Manufacturing | |
| 4. Construction | |
| 5. Automotive | |
| 6. Others | |
| By Region | 1. North America (US and Canada) |
| 2. Europe (UK, Germany, France and Rest of Europe) | |
| 3. Asia Pacific (China, Japan, India and Rest of Asia Pacific) | |
| 4. Latin America (Brazil, Mexico and Rest of Latin America) | |
| 5. Middle East & Africa (GCC and Rest of Middle East & Africa) | |
The ultrasonic testing segment is expected to grow at the fastest rate, a CAGR of 10.5%, during the forecast period
Based on type, the market has been segmented into visual testing, magnetic particle testing, liquid penetrant testing, radiography testing, ultrasonic testing, and eddy current testing. Among these types of non-destructive testing, the ultrasonic testing segment is projected to exhibit the fastest growth in the global market during the forecast period. This is owing to its ease of handling, accurate fault detection, and availability of skilled professionals that can operate ultrasonic testing equipment. Many techniques have been developed to allow full volumetric inspection of an extensive range of components made from a wide variety of materials. It is probably the most important method used in the industry.
Based on Industry Vertical, the manufacturing segment contributes a major share in the global market
Based on Industry Vertical, the market has been segmented into oil & gas, aerospace & defense, manufacturing, construction, automotive, and others. The manufacturing segment accounted to register a remarkable share of 34% in the global market. The high demand for a range of testing methods for checking the quality of the quality is driving the segmental growth in the market. Non-destructive testing finds its application in the manufacturing of automotive and aerospace components.

Asia Pacific to exhibit the fastest growth in the global market throughout the forecast period
Asia Pacific is projected to witness the fastest growth rate, at a CAGR of 29%, in the global non-destructive testing market during the forecast period. This growth is mainly attributed to the rising manufacturing sector in the emerging economies of the region, such as India and China. Moreover, the presence of some of the key market players in the region, namely Olympus Corporation and Fujifilm Corporation, is another factor that significantly drives the growth of the market in Asia Pacific.
Company Profiles and Competitive Intelligence
The major players operating in the global non-destructive testing market are SGS SA (Switzerland), Bureau Veritas SA (France), Intertek Group PLC (UK), Olympus Corporation (Japan), MISTRAS Group, Inc. (US), Fujifilm Corporation (Japan), General Electric Company (US), Nikon Corporation (Japan), Yxlon International GmbH (US), and Sonatest Ltd. (UK), among others.

Ask for free product review call with the author

Share your specific research requirements for a customized report

Request for due diligence and consumer centric studies

Request for study updates, segment specific and country level reports
Chapter 1 Executive Summary
1.1. Market Summary
1.1.1. Global Non-Destructive Testing Market, 2016-2026, (USD Million)
1.2. Market Snapshot: Global Non-Destructive Testing Market
1.3. Market Dynamics
1.4. Global Non-Destructive Testing Market, by Segment, 2018
1.4.1. Global Non-Destructive Testing Market, by Type, 2018, (USD Million)
1.4.2. Global Non-Destructive Testing Market, by Industry Vertical, 2018, (USD Million)
1.4.3. Global Non-Destructive Testing Market, by Region, 2018 (USD Million)
1.5. Premium Insights
1.5.1. Non-Destructive Testing Market In Developed Vs. Developing Economies, 2018 vs 2026
1.5.2. Global Non-Destructive Testing Market: Regional Life Cycle Analysis
Chapter 2 Market Dynamics
2.1. Market Overview
2.2. Market Drivers
2.2.1. Stringent governmental regulations for product safety
2.2.2. Increase in demand for defect detection to minimize repairing cost
2.3. Market Restraints
2.3.1. Lack of awareness and skilled professional
2.4. Market Opportunities
2.4.1. Introduction of AI in non-destructive testing
2.5. Industry Value Chain Analysis
2.6. Pricing Analysis
2.7. Porter’s Five Forces Analysis
Chapter 3 Global Non-Destructive Testing Market, by Type
3.1. Market Overview, by Type
3.1.1. Global Non-Destructive Testing Market, by Type, 2016-2026 (USD Million)
3.1.2. Incremental Opportunity, by Type, 2018
3.2. Visual Testing
3.2.1. Global Non-Destructive Testing Market, by Visual Testing, 2016-2026, (USD Million)
3.3. Magnetic Particle Testing
3.3.1. Global Non-Destructive Testing Market, by Magnetic Particle Testing, 2016-2026, (USD Million)
3.4. Liquid Penetrant Testing
3.4.1. Global Non-Destructive Testing Market, by Liquid Penetrant Testing, 2016-2026, (USD Million)
3.5. Radiography Testing
3.5.1. Global Non-Destructive Testing Market, by Radiography Testing, 2016-2026, (USD Million)
3.6. Ultrasonic Testing
3.6.1. Global Non-Destructive Testing Market, by Ultrasonic Testing, 2016-2026, (USD Million)
3.7. Eddy Current Testing
3.7.1. Global Non-Destructive Testing Market, by Eddy Current Testing, 2016-2026, (USD Million)
3.8. Others
3.8.1. Global Non-Destructive Testing Market, by Others, 2016-2026, (USD Million)
Chapter 4 Global Non-Destructive Testing Market, by Industry Vertical
4.1. Market Overview, by Industry Vertical
4.1.1. Global Non-Destructive Testing Market, by Industry Vertical, 2016-2026 (USD Million)
4.1.2. Incremental Opportunity, by Industry Vertical, 2018
4.2. Oil & Gas
4.2.1. Global Non-Destructive Testing Market, by Oil & Gas, 2016-2026, (USD Million)
4.3. Aerospace & Defense
4.3.1. Global Non-Destructive Testing Market, by Aerospace & Defense, 2016-2026, (USD Million)
4.4. Manufacturing
4.4.1. Global Non-Destructive Testing Market, by Manufacturing, 2016-2026, (USD Million)
4.5. Construction
4.5.1. Global Non-Destructive Testing Market, by Construction, 2016-2026, (USD Million)
4.6. Automotive
4.6.1. Global Non-Destructive Testing Market, by Automotive, 2016-2026, (USD Million)
4.7. Others
4.7.1. Global Non-Destructive Testing Market, by Others, 2016-2026, (USD Million)
Chapter 5 Global Non-Destructive Testing Market, by Region
5.1. Market Overview, by Region
5.1.1. Global Non-Destructive Testing Market, by Region, 2016-2026, (USD Million)
5.2. Attractive Investment Opportunity, by Region, 2018
5.3. North America Non-Destructive Testing Market
5.3.1. North America Non-Destructive Testing Market, by Type, 2016-2026 (USD Million)
5.3.2. North America Non-Destructive Testing Market, by Industry Vertical, 2016-2026 (USD Million)
5.3.3. United States Non-Destructive Testing Market, 2016-2026 (USD Million)
5.3.4. Canada Non-Destructive Testing Market, 2016-2026 (USD Million)
5.4. Europe Non-Destructive Testing Market
5.4.1. Europe Non-Destructive Testing Market, by Type, 2016-2026 (USD Million)
5.4.2. Europe Non-Destructive Testing Market, by Industry Vertical, 2016-2026 (USD Million)
5.4.3. United Kingdom Non-Destructive Testing Market, 2016-2026 (USD Million)
5.4.4. Germany Non-Destructive Testing Market, 2016-2026 (USD Million)
5.4.5. France Non-Destructive Testing Market, 2016-2026 (USD Million)
5.4.6. Rest of Europe Non-Destructive Testing Market, 2016-2026 (USD Million)
5.5. Asia Pacific Non-Destructive Testing Market
5.5.1. Asia Pacific Non-Destructive Testing Market, by Type, 2016-2026 (USD Million)
5.5.2. Asia Pacific Non-Destructive Testing Market, by Industry Vertical, 2016-2026 (USD Million)
5.5.3. China Non-Destructive Testing Market, 2016-2026 (USD Million)
5.5.4. Japan Non-Destructive Testing Market, 2016-2026 (USD Million)
5.5.5. India Non-Destructive Testing Market, 2016-2026 (USD Million)
5.5.6. Rest of Asia Pacific Non-Destructive Testing Market, 2016-2026 (USD Million)
5.6. Latin America Non-Destructive Testing Market
5.6.1. Latin America Non-Destructive Testing Market, by Type, 2016-2026 (USD Million)
5.6.2. Latin America Non-Destructive Testing Market, by Industry Vertical, 2016-2026 (USD Million)
5.6.3. Brazil Non-Destructive Testing Market, 2016-2026 (USD Million)
5.6.4. Mexico Non-Destructive Testing Market, 2016-2026 (USD Million)
5.6.5. Rest of Latin America Non-Destructive Testing Market, 2016-2026 (USD Million)
5.7. Middle East & Africa Non-Destructive Testing Market
5.7.1. Middle East & Africa Non-Destructive Testing Market, by Type, 2016-2026 (USD Million)
5.7.2. Middle East & Africa Non-Destructive Testing Market, by Industry Vertical, 2016-2026 (USD Million)
5.7.3. GCC Non-Destructive Testing Market, 2016-2026 (USD Million)
5.7.4. Rest of Middle East & Africa Non-Destructive Testing Market, 2016-2026 (USD Million)
Chapter 6 Competitive Intelligence
6.1. Top 5 Players Comparison
6.2. Market Positioning of Key Players, 2018
6.3. Market Players Mapping
6.3.1. By Type
6.3.2. By Industry Vertical
6.3.3. By Region
6.4. Strategies Adopted by Key Market Players
6.5. Recent Developments in the Market
6.5.1. Mergers & Acquisitions, Partnership, New Type Developments
Chapter 7 Company Profiles
7.1. SGS SA
7.1.1. SGS SA Overview
7.1.2. SGS SA Types Portfolio
7.1.3. SGS SA Financial Overview
7.1.4. SGS SA News/Recent Developments
7.2. Bureau Veritas SA
7.2.1. Bureau Veritas SA Overview
7.2.2. Bureau Veritas SA Types Portfolio
7.2.3. Bureau Veritas SA Financial Overview
7.2.4. Bureau Veritas SA News/Recent Developments
7.3. Intertek Group PLC
7.3.1. Intertek Group PLC Overview
7.3.2. Intertek Group PLC Types Portfolio
7.3.3. Intertek Group PLC Financial Overview
7.3.4. Intertek Group PLC News/Recent Developments
7.4. Olympus Corporation
7.4.1. Olympus Corporation Overview
7.4.2. Olympus Corporation Types Portfolio
7.4.3. Olympus Corporation Financial Overview
7.4.4. Olympus Corporation News/Recent Developments
7.5. MISTRAS Group, Inc.
7.5.1. MISTRAS Group, Inc. Overview
7.5.2. MISTRAS Group, Inc. Types Portfolio
7.5.3. MISTRAS Group, Inc. Financial Overview
7.5.4. MISTRAS Group, Inc. News/Recent Developments
7.6. Fujifilm Corporation
7.6.1. Fujifilm Corporation Overview
7.6.2. Fujifilm Corporation Types Portfolio
7.6.3. Fujifilm Corporation Financial Overview
7.6.4. Fujifilm Corporation News/Recent Developments
7.7. General Electric Company
7.7.1. General Electric Company Overview
7.7.2. General Electric Company Types Portfolio
7.7.3. General Electric Company Financial Overview
7.7.4. General Electric Company News/Recent Developments
7.8. Nikon Corporation
7.8.1. Nikon Corporation Overview
7.8.2. Nikon Corporation Types Portfolio
7.8.3. Nikon Corporation Financial Overview
7.8.4. Nikon Corporation News/Recent Developments
7.9. Yxlon International GmbH
7.9.1. Yxlon International GmbH Overview
7.9.2. Yxlon International GmbH Types Portfolio
7.9.3. Yxlon International GmbH Financial Overview
7.9.4. Yxlon International GmbH News/Recent Developments
7.10. Sonatest Ltd.
7.10.1. Sonatest Ltd. Overview
7.10.2. Sonatest Ltd. Types Portfolio
7.10.3. Sonatest Ltd. Financial Overview
7.10.4. Sonatest Ltd. News/Recent Developments
Chapter 8 Preface
8.1. Data Triangulation
8.2. Research Methodology
8.2.1. Phase I – Secondary Research
8.2.2. Phase II – Primary Research
8.2.3. Phase III – Expert Panel Review
8.2.4. Approach Adopted
8.2.4.1. Top-Down Approach
8.2.4.2. Bottom-Up Approach
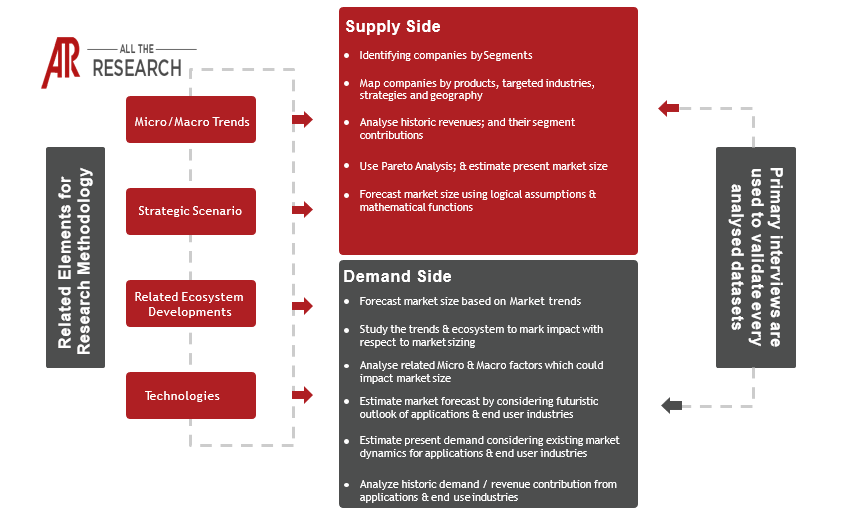
8.2.5. Supply- Demand side
8.2.6. Breakup of the Primary Profiles
