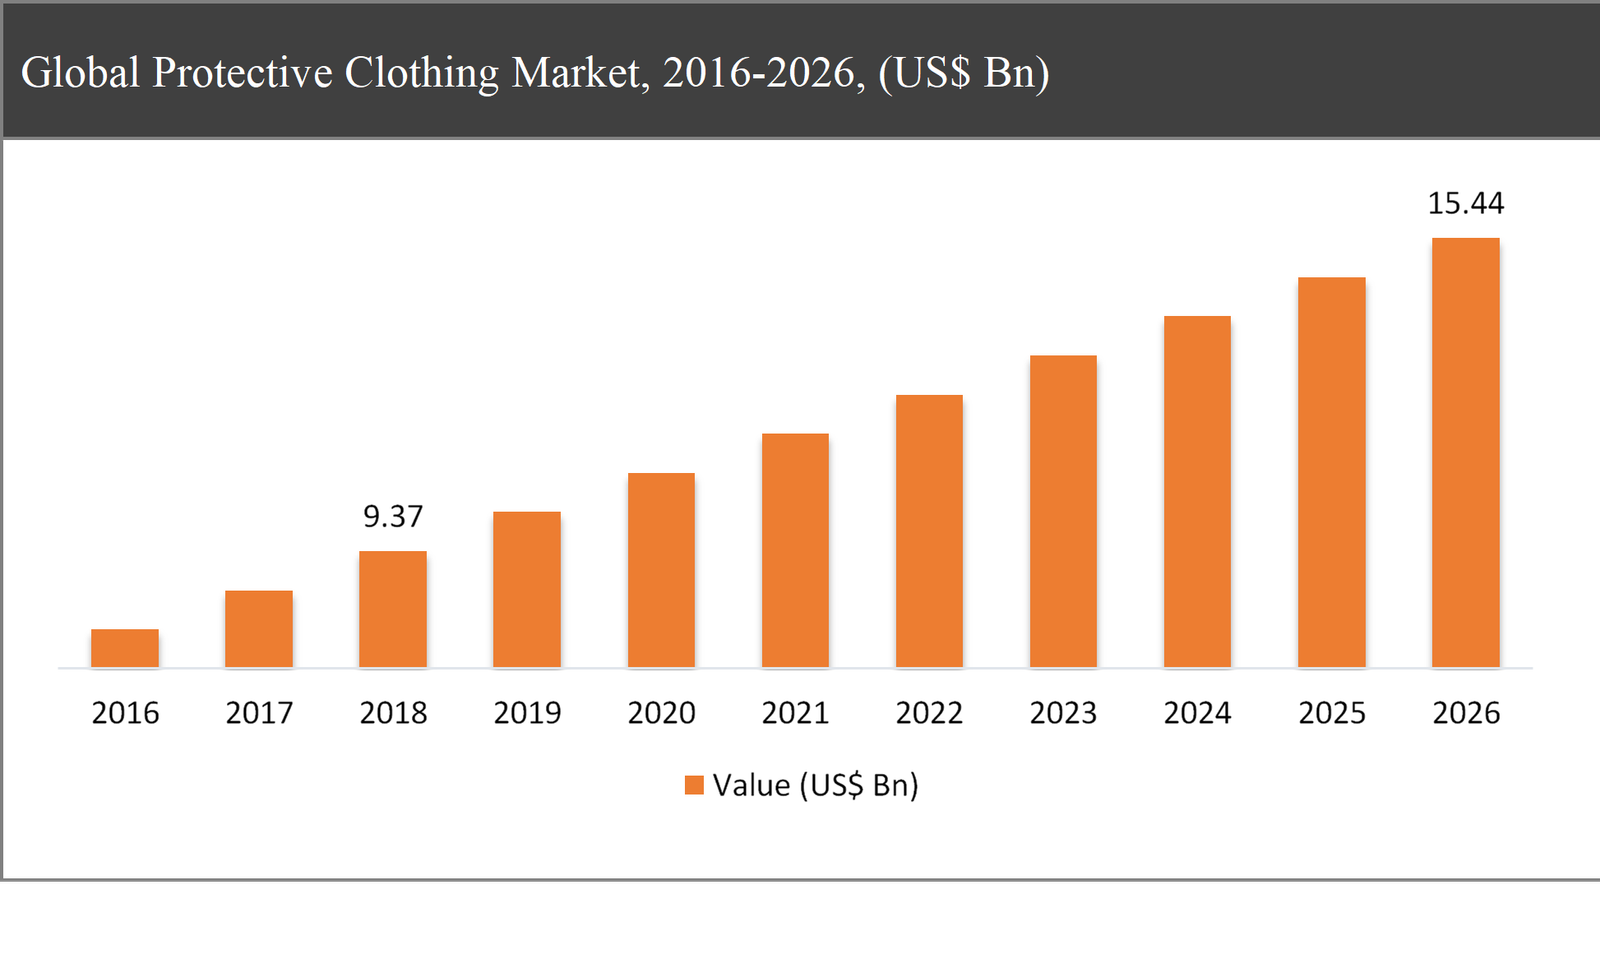
The global protective clothing market was valued at USD 9.37 billion in 2018 and is expected to reach USD 15.44 billion in 2026, growing at a CAGR of 6.5% during the forecast period.
Protective clothing is a type of wearable which is intended to avoid the user or an object to come in direct contact with hazardous element including chemical and fire among others. These are designed to provide protection from unwanted exposures and reduce the adversity or prevent accidents. Different types of raw materials have been developed over the years for their usage as protective clothing in various industry verticals. The purposes of protective clothing may vary depending upon the end-use industry, such as fire-resistant clothing for firefighting & law enforcement department and UV resistant clothing for the chemical industry. Protective clothing can also be used for protection against cold, high temperature, ballistic resistance, chemical resistant, among others.
Protective Clothing Market Segmentation |
|
| By Material Type | 1. Areamid & Blends |
| 2. Polyolefin & Blends | |
| 3. Cotton Fibers | |
| 4. Laminated Polyster | |
| 5. Polyamide | |
| 6. UHMW PE | |
| 7. Laminated Polyster | |
| 8. Others | |
| By Application | 1. Thermal |
| 2. Visibility | |
| 3. Mechanical | |
| 4. Chemical | |
| 5. Biological/Radiation | |
| 6. Others | |
| By End-use Industry | 1. Construction |
| 2. Manufacturing | |
| 3. Oil & Gas | |
| 4. Firefighting & Law Enforcement | |
| 5. Healthcare/Medical | |
| 6. Mining | |
| 7. Warehouse & Logistics | |
| 8. Others | |
| By Region | 1. North America (US and Canada) |
| 2. Europe (UK, Germany, France and Rest of Europe) | |
| 3. Asia Pacific (China, Japan, India and Rest of Asia Pacific) | |
| 4. Latin America (Brazil, Mexico and Rest of Latin America) | |
| 5. Middle East & Africa (GCC and Rest of Middle East & Africa) | |
Increasing government regulations for the workplace safety of labors as well as proactive initiatives by several industrial verticals to implement safety standards and guidelines are some of the major factors which are driving the growth of global protective clothing industry growth globally. On the other hand, a substantial investment of resources into research & development of efficient clothing for protection against various environmental and industrial conditions is leading to further growth of the market. New product launches are exploring untapped application segments which are anticipated to propel the market growth in the forecast period. Conversely, the high price of specialized protective clothing is proving to be a major hindrance to the market in the near future.
The aramid & blends material type of protective clothing expected to grow at the fastest rate of 8.7% CAGR during the forecast period
Based on material type, the global protective clothing market has been segmented into aramid & blends, polyolefin & blends, cotton fibers, laminated polyester, polyamide, UHMW PE, laminated polyester, and others. The aramid & blends segment is expected to grow at the highest CAGR of around 8.2% during the forecast period. Greater efficiency and suitability for multiple applications are some of the key driving factors for the growth of aramid & blends segment globally.
Based on application, the biological and radiation segment is anticipated to grow at fastest rate during the forecast period
Based on the application, the market has been segmented into thermal, visibility, mechanical, chemical, biological/radiation, and others. The biological and radiation segment is anticipated to showcase a tremendous growth rate during the forecast period. This growth is attributed to rapid growth in end-use industries in developing economies. Rapid growth in the nuclear industry which is coupled with the development of the biological sector is some of the major drivers for the industry globally.
Based on end use industry, the oil & gas segment is expected to lead during the forecast period
Based on end use industry, the market has been segmented into construction, manufacturing, oil & gas, firefighting & law enforcement, healthcare/medical, mining, military, warehouse & logistics, and others. The oil & gas segment came out as a leading sector for the global protective clothing market by accounting for more than 24% of the total market, in 2018. Rising oil & gas exploration activities across the globe are one of the major factors driving the segmental growth.
North America to dominate the protective clothing market throughout the forecast period
North America region is by far the largest contributor to the growth of the global protective clothing market which contributed more than 32% market share globally. However, the Asia Pacific region is anticipated to showcase the highest growth rate during the forecast period owing to intensifying investments from global industry players.
Company Profiles and Competitive Intelligence:
The major players operating in the global protective clothing market are Ansell Limited (US), E.I. du Pont de Nemours and Company (US), 3M Company (US), Sioen Industries (Belgium), Kimberly Clark Corp (US), and Lakeland Industries, Inc. (US), W.L. Gore & Associates, Inc. (US) Honeywell International Inc. (US) and Teijin Limited (Japan) among others.

Ask for free product review call with the author

Share your specific research requirements for a customized report

Request for due diligence and consumer centric studies

Request for study updates, segment specific and country level reports
Chapter 1 Executive Summary
1.1. Market Summary
1.1.1. Global Protective Clothing Market, 2016-2026, (USD Million)
1.2. Market Snapshot: Global Protective Clothing Market
1.3. Market Dynamics
1.4. Global Protective Clothing Market, by Segment, 2018
1.4.1. Global Protective Clothing Market, by Material Type, 2018, (USD Million)
1.4.2. Global Protective Clothing Market, by Application, 2018, (USD Million)
1.4.3. Global Protective Clothing Market, by End Use Industry, 2018, (USD Million)
1.4.4. Global Protective Clothing Market, by Region, 2018 (USD Million)
1.5. Premium Insights
1.5.1. Protective Clothing Market In Developed Vs. Developing Economies, 2018 vs 2026
1.5.2. Global Protective Clothing Market: Regional Life Cycle Analysis
Chapter 2 Market Dynamics
2.1. Market Overview
2.2. Market Drivers
2.2.1. Imposition of stringent regulations for labor safety
2.2.2. Growing awareness in developing economies
2.3. Market Restraints
2.3.1. High cost of specialized products
2.3.2. Long development period
2.4. Market Opportunities
2.4.1. Rapidly growing various industrial sectors
2.4.2. Growing trend of multifunctional clothing
2.5. Industry Value Chain Analysis
2.6. Pricing Analysis
2.7. Porter’s Five Forces Analysis
Chapter 3 Global Protective Clothing Market, by Material Type
3.1. Market Overview, by Material Type
3.1.1. Global Protective Clothing Market, by Material Type, 2016-2026 (USD Million)
3.1.2. Incremental Opportunity, by Material Type, 2018
3.2. Aramid & Blends
3.2.1. Global Protective Clothing Market, by Aramid & Blends, 2016-2026, (USD Million)
3.3. Polyolefin & Blends
3.3.1. Global Protective Clothing Market, by Polyolefin & Blends, 2016-2026, (USD Million)
3.4. Cotton Fibers
3.4.1. Global Protective Clothing Market, by Cotton Fibers, 2016-2026, (USD Million)
3.5. Laminated Polyester
3.5.1. Global Protective Clothing Market, by Laminated Polyester, 2016-2026, (USD Million)
3.6. Polyamide
3.6.1. Global Protective Clothing Market, by Polyamide, 2016-2026, (USD Million)
3.7. UHMW PE
3.7.1. Global Protective Clothing Market, by UHMW PE, 2016-2026, (USD Million)
3.8. Laminated Polyester
3.8.1. Global Protective Clothing Market, by Laminated Polyester, 2016-2026, (USD Million)
3.9. Others
3.9.1. Global Protective Clothing Market, by Others, 2016-2026, (USD Million)
Chapter 4 Global Protective Clothing Market, by Application
4.1. Market Overview, by Application
4.1.1. Global Protective Clothing Market, by Application, 2016-2026 (USD Million)
4.1.2. Incremental Opportunity, by Application, 2018
4.2. Thermal
4.2.1. Global Protective Clothing Market, by Thermal, 2016-2026, (USD Million)
4.3. Visibility
4.3.1. Global Protective Clothing Market, by Visibility, 2016-2026, (USD Million)
4.4. Mechanical
4.4.1. Global Protective Clothing Market, by Mechanical, 2016-2026, (USD Million)
4.5. Chemical
4.5.1. Global Protective Clothing Market, by Chemical, 2016-2026, (USD Million)
4.6. Biological/Radiation
4.6.1. Global Protective Clothing Market, by Biological/Radiation, 2016-2026, (USD Million)
4.7. Others
4.7.1. Global Protective Clothing Market, by Others, 2016-2026, (USD Million)
Chapter 5 Global Protective Clothing Market, by End Use Industry
5.1. Market Overview, by End Use Industry
5.1.1. Global Protective Clothing Market, by End Use Industry, 2016-2026 (USD Million)
5.1.2. Incremental Opportunity, by End Use Industry, 2018
5.2. Construction
5.2.1. Global Protective Clothing Market, by Construction, 2016-2026, (USD Million)
5.3. Manufacturing
5.3.1. Global Protective Clothing Market, by Manufacturing, 2016-2026, (USD Million)
5.4. Oil & Gas
5.4.1. Global Protective Clothing Market, by Oil & Gas, 2016-2026, (USD Million)
5.5. Firefighting & Law Enforcement
5.5.1. Global Protective Clothing Market, by Firefighting & Law Enforcement, 2016-2026, (USD Million)
5.6. Healthcare/Medical
5.6.1. Global Protective Clothing Market, by Healthcare/Medical, 2016-2026, (USD Million)
5.7. Mining
5.7.1. Global Protective Clothing Market, by Mining, 2016-2026, (USD Million)
5.8. Military
5.8.1. Global Protective Clothing Market, by Military, 2016-2026, (USD Million)
5.9. Warehouse & Logistics
5.9.1. Global Protective Clothing Market, by Warehouse & Logistics, 2016-2026, (USD Million)
5.10. Others
5.10.1. Global Protective Clothing Market, by Others, 2016-2026, (USD Million)
Chapter 6 Global Protective Clothing Market, by Region
6.1. Market Overview, by Region
6.1.1. Global Protective Clothing Market, by Region, 2016-2026, (USD Million)
6.1.2. Attractive Investment Opportunity, by Region, 2018
6.2. North America Protective Clothing Market
6.2.1. North America Protective Clothing Market, by Material Type, 2016-2026 (USD Million)
6.2.2. North America Protective Clothing Market, by Application, 2018, (USD Million)
6.2.3. North America Protective Clothing Market, by End Use Industry, 2016-2026 (USD Million)
6.2.4. United States Protective Clothing Market, 2016-2026 (USD Million)
6.2.5. Canada Protective Clothing Market, 2016-2026 (USD Million)
6.3. Europe Protective Clothing Market
6.3.1. Europe Protective Clothing Market, by Material Type, 2016-2026 (USD Million)
6.3.2. Europe Protective Clothing Market, by Application, 2018, (USD Million)
6.3.3. Europe Protective Clothing Market, by End Use Industry, 2016-2026 (USD Million)
6.3.4. United Kingdom Protective Clothing Market, 2016-2026 (USD Million)
6.3.5. Germany Protective Clothing Market, 2016-2026 (USD Million)
6.3.6. France Protective Clothing Market, 2016-2026 (USD Million)
6.3.7. Rest of Europe Protective Clothing Market, 2016-2026 (USD Million)
6.4. Asia Pacific Protective Clothing Market
6.4.1. Asia Pacific Protective Clothing Market, by Material Type, 2016-2026 (USD Million)
6.4.2. Asia Pacific Protective Clothing Market, by Application, 2018, (USD Million)
6.4.3. Asia Pacific Protective Clothing Market, by End Use Industry, 2016-2026 (USD Million)
6.4.4. China Protective Clothing Market, 2016-2026 (USD Million)
6.4.5. Japan Protective Clothing Market, 2016-2026 (USD Million)
6.4.6. India Protective Clothing Market, 2016-2026 (USD Million)
6.4.7. Rest of Asia Pacific Protective Clothing Market, 2016-2026 (USD Million)
6.5. Latin America Protective Clothing Market
6.5.1. Latin America Protective Clothing Market, by Material Type, 2016-2026 (USD Million)
6.5.2. Latin America Protective Clothing Market, by Application, 2018, (USD Million)
6.5.3. Latin America Protective Clothing Market, by End Use Industry, 2016-2026 (USD Million)
6.5.4. Brazil Protective Clothing Market, 2016-2026 (USD Million)
6.5.5. Mexico Protective Clothing Market, 2016-2026 (USD Million)
6.5.6. Rest of Latin America Protective Clothing Market, 2016-2026 (USD Million)
6.6. Middle East & Africa Protective Clothing Market
6.6.1. Middle East & Africa Protective Clothing Market, by Material Type, 2016-2026 (USD Million)
6.6.2. Middle East & Africa Protective Clothing Market, by Application, 2018, (USD Million)
6.6.3. Middle East & Africa Protective Clothing Market, by End Use Industry, 2016-2026 (USD Million)
6.6.4. GCC Protective Clothing Market, 2016-2026 (USD Million)
6.6.5. Rest of Middle East & Africa Protective Clothing Market, 2016-2026 (USD Million)
Chapter 7 Competitive Intelligence
7.1. Top 5 Players Comparison
7.2. Market Positioning of Key Players, 2018
7.3. Market Players Mapping
7.3.1. By Material Type
7.3.2. By Application
7.3.3. By End Use Industry
7.3.4. By Region
7.4. Strategies Adopted by Key Market Players
7.5. Recent Developments in the Market
7.5.1. Mergers & Acquisitions, Partnership, New Material Type Developments
Chapter 8 Company Profiles
8.1. 3M Company
8.1.1. 3M Company Overview
8.1.2. 3M Company Product Portfolio
8.1.3. 3M Company Financial Overview
8.1.4. 3M Company News/Recent Developments
8.2. E.I. Du Pont De Nemours and Company
8.2.1. E.I. Du Pont De Nemours and Company Overview
8.2.2. E.I. Du Pont De Nemours and Company Product Portfolio
8.2.3. E.I. Du Pont De Nemours and Company Financial Overview
8.2.4. E.I. Du Pont De Nemours and Company News/Recent Developments
8.3. Ansell Limited
8.3.1. Ansell Limited Overview
8.3.2. Ansell Limited Product Portfolio
8.3.3. Ansell Limited Financial Overview
8.3.4. Ansell Limited News/Recent Developments
8.4. Honeywell International
8.4.1. Honeywell International Overview
8.4.2. Honeywell International Product Portfolio
8.4.3. Honeywell International Financial Overview
8.4.4. Honeywell International News/Recent Developments
8.5. Kimberly Clark Co
8.5.1. Kimberly Clark Co Overview
8.5.2. Kimberly Clark Co Product Portfolio
8.5.3. Kimberly Clark Co Financial Overview
8.5.4. Kimberly Clark Co News/Recent Developments
8.6. Lakeland Industries Inc.
8.6.1. Lakeland Industries Inc. Overview
8.6.2. Lakeland Industries Inc. Product Portfolio
8.6.3. Lakeland Industries Inc. Financial Overview
8.6.4. Lakeland Industries Inc. News/Recent Developments
8.7. Royal Tencate NV
8.7.1. Royal Tencate NV Overview
8.7.2. Royal Tencate NV Product Portfolio
8.7.3. Royal Tencate NV Financial Overview
8.7.4. Royal Tencate NV News/Recent Developments
8.8. Teijin Limited
8.8.1. Teijin Limited Overview
8.8.2. Teijin Limited Product Portfolio
8.8.3. Teijin Limited Financial Overview
8.8.4. Teijin Limited News/Recent Developments
8.9. Sioen Industries NV
8.9.1. Sioen Industries NV Overview
8.9.2. Sioen Industries NV Product Portfolio
8.9.3. Sioen Industries NV Financial Overview
8.9.4. Sioen Industries NV News/Recent Developments
8.10. W.L. Gore & Associates, Inc.
8.10.1. W.L. Gore & Associates, Inc. Overview
8.10.2. W.L. Gore & Associates, Inc. Product Portfolio
8.10.3. W.L. Gore & Associates, Inc. Financial Overview
8.10.4. W.L. Gore & Associates, Inc. News/Recent Developments
Chapter 9 Preface
9.1. Data Triangulation
9.2. Research Methodology
9.2.1. Phase I – Secondary Research
9.2.2. Phase II – Primary Research
9.2.3. Phase III – Expert Panel Review
9.2.4. Approach Adopted
9.2.4.1. Top-Down Approach
9.2.4.2. Bottom-Up Approach
9.2.5. Supply- Demand side
9.2.6. Breakup of the Primary Profiles


 Log in / Register


