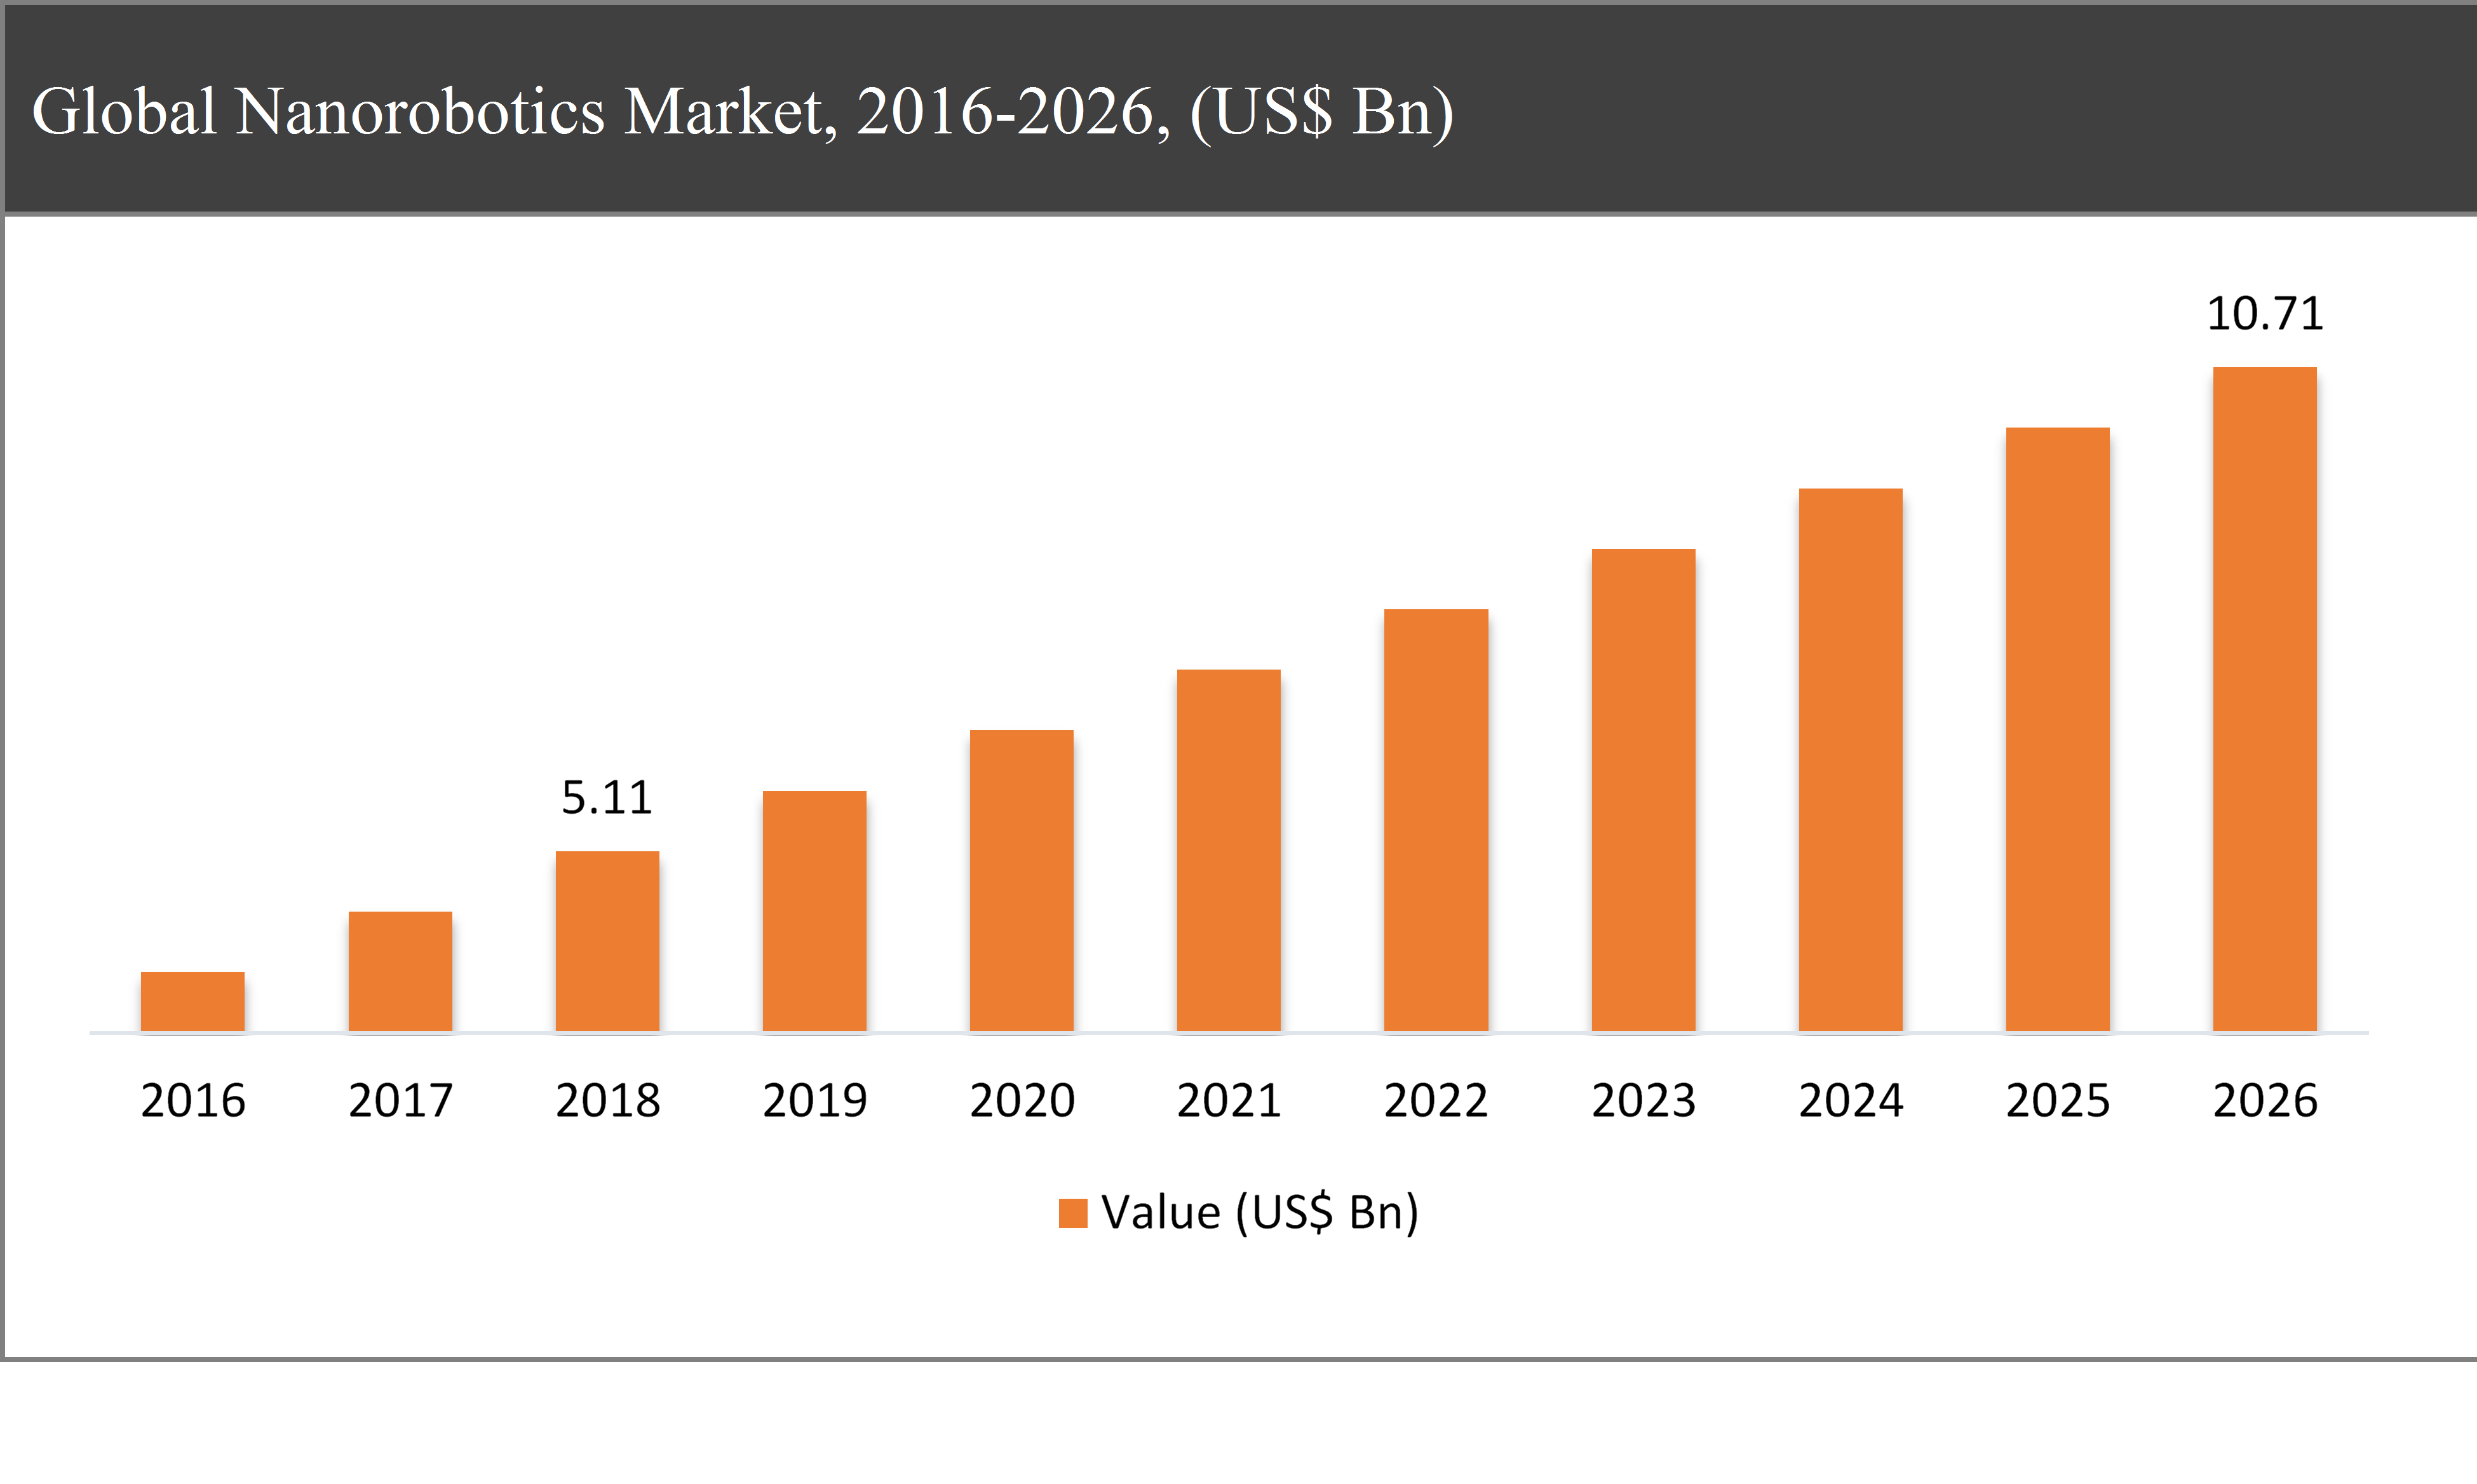
Global nanorobotics market was valued at USD 5.11 billion in 2018 and is expected to reach USD 10.71 billion in 2026, growing at a CAGR of 9.9% during the forecast period.
Nanorobotics is one of the developing fields of technology which deals in constructing a robotic machine that is at the scale of a nanometer. Nanorobotics technology holds the substantial potential to develop evolving medical diagnosis and treatment owing to its exceptional ability to operate and perform a multi-level complex task although at small scales. Nanorobotics technology can be applied to several noticeable applications in medical and surgical science. Critical research for diseases such as AIDS and Cancer is hugely benefitted by the advancement of nanorobotics.
Nanorobotics Market Segmentation |
|
| By Type | 1. Nanomanipulator |
| 2. Bio-Nanorobotics | |
| 3. Magnetically Guided | |
| 4. Bacteria-Based | |
| By Application | 1. Nanomedicine |
| 2. Biomedical | |
| 3. Mechanical | |
| 4. Others | |
| By Region | 1. North America (US and Canada) |
| 2. Europe (UK, Germany, France and Rest of Europe) | |
| 3. Asia Pacific (China, Japan, India and Rest of Asia Pacific) | |
| 4. Latin America (Brazil, Mexico and Rest of Latin America) | |
| 5. Middle East & Africa (GCC and Rest of Middle East & Africa) | |
The global nanorobotics market is positively benefitted by factors such as evolving medical science and increasing demand for miniaturization of semiconductor and electronics devices. Moreover, various nanorobotics supportive initiatives undertaken by the governments are encouraging investments in this sector which is resulting into growing emphasis on nanotechnology, the surge in demand for automation across healthcare sectors, and increasing technological advancements of molecular robot sector are some of the factors responsible for the growth of the nanorobotics market. On the other hand, the complex manufacturing process which leads to high production cost is one of the major factors that affect the growth of the global nanorobotics market. However, advancement in nanotechnology and growing adoption of automation in the medical sector offers several growth opportunities in the near future.
The magnetically guided type of nanorobotics system segment is expected to grow at the fastest rate of 12.3% CAGR during the forecast period in nanorobotics industry globally
Based on the type, the global nanorobotics market has been segmented into nano manipulator, bio-nanorobotics, magnetically guided, and bacteria-based. Magnetically guided nanorobots offer a high degree of maneuverability in complex operations, hence find a huge demand for many applications. Magnetically guided nanorobot systems are employed to carry and deliver live cells to targeted areas in the body.
Based on applications, the nanomedicine segment is anticipated to grow at fastest rate and dominate the market during the forecast period
Based on applications, the market has been segmented into nanomedicine, biomedical, mechanical, and others. Nanomedicine is one of the crucial medical applications of nanotechnology. The nanomedicine segment is anticipated to showcase a tremendous growth rate during the forecast period owing to the rising emphasis on developing effective medical solutions. This segment is also expected to hold a major market share of 38% in 2018. Nanomedicine technology offers multiple solutions which include nanomaterials and biological devices, nanoelectronic biosensors, and molecular nanotechnology which include biological machines. Rapid growth in investments for nanomedicine industry is driving the growth of this segment in the global nanorobotics market.
North America to dominate the nanorobotics market throughout the forecast period
North America region is by far the largest contributor to the growth of the global nanorobotics market which contributed more than 32% market share globally. However, the Asia Pacific region is anticipated to showcase the highest growth rate during the forecast period owing to intensifying healthcare demands and market positioning from global industry players.
Company Profiles and Competitive Intelligence:
The major players operating in the global nanorobotics market are

Ask for free product review call with the author

Share your specific research requirements for a customized report

Request for due diligence and consumer centric studies

Request for study updates, segment specific and country level reports
TABLE OF CONTENT
Chapter 1 Executive Summary
1.1. Market Summary
1.1.1. Global Nanorobotics Market, 2016-2026, (USD Million)
1.2. Market Snapshot: Global Nanorobotics Market
1.3. Market Dynamics
1.4. Global Nanorobotics Market, by Segment, 2018
1.4.1. Global Nanorobotics Market, by Type, 2018, (USD Million)
1.4.2. Global Nanorobotics Market, by Applications, 2018, (USD Million)
1.4.3. Global Nanorobotics Market, by Region, 2018 (USD Million)
1.5. Premium Insights
1.5.1. Nanorobotics Market In Developed Vs. Developing Economies, 2018 vs 2026
1.5.2. Global Nanorobotics Market: Regional Life Cycle Analysis
Chapter 2 Market Dynamics
2.1. Market Overview
2.2. Market Drivers
2.2.1. Rising demand of molecular robots
2.2.2. Advancement of nanotechnology
2.3. Market Restraints
2.3.1. Stringent government excise duties
2.3.2. Complexity in manufacturing
2.4. Market Opportunities
2.4.1. Growing demand from emerging nations
2.4.2. New application areas of microscopy
2.5. Industry Value Chain Analysis
2.6. Pricing Analysis
2.7. Porter’s Five Forces Analysis
Chapter 3 Global Nanorobotics Market, by Type
3.1. Market Overview, by Type
3.1.1. Global Nanorobotics Market, by Type, 2016-2026 (USD Million)
3.1.2. Incremental Opportunity, by Type, 2018
3.2. Nanomanipulator
3.2.1. Global Nanorobotics Market, by Nanomanipulator, 2016-2026, (USD Million)
3.3. Bio-Nanorobotics
3.3.1. Global Nanorobotics Market, by Bio-Nanorobotics, 2016-2026, (USD Million)
3.4. Magnetically Guided
3.4.1. Global Nanorobotics Market, by Magnetically Guided, 2016-2026, (USD Million)
3.5. Bacteria-Based
3.5.1. Global Nanorobotics Market, by Bacteria-Based, 2016-2026, (USD Million)
Chapter 4 Global Nanorobotics Market, by Applications
4.1. Market Overview, by Applications
4.1.1. Global Nanorobotics Market, by Applications, 2016-2026 (USD Million)
4.1.2. Incremental Opportunity, by Applications, 2018
4.2. Nanomedicine
4.2.1. Global Nanorobotics Market, by Nanomedicine, 2016-2026, (USD Million)
4.3. Biomedical
4.3.1. Global Nanorobotics Market, by Biomedical, 2016-2026, (USD Million)
4.4. Mechanical
4.4.1. Global Nanorobotics Market, by Mechanical, 2016-2026, (USD Million)
4.5. Others
4.5.1. Global Nanorobotics Market, by Others, 2016-2026, (USD Million)
Chapter 5 Global Nanorobotics Market, by Region
5.1. Market Overview, by Region
5.1.1. Global Nanorobotics Market, by Region, 2016-2026, (USD Million)
5.1.2. Attractive Investment Opportunity, by Region, 2018
5.2. North America Nanorobotics Market
5.2.1. North America Nanorobotics Market, by Type, 2016-2026 (USD Million)
5.2.2. North America Nanorobotics Market, by Applications, 2016-2026 (USD Million)
5.2.3. United States Nanorobotics Market, 2016-2026 (USD Million)
5.2.4. Canada Nanorobotics Market, 2016-2026 (USD Million)
5.3. Europe Nanorobotics Market
5.3.1. Europe Nanorobotics Market, by Type, 2016-2026 (USD Million)
5.3.2. Europe Nanorobotics Market, by Applications, 2016-2026 (USD Million)
5.3.3. United Kingdom Nanorobotics Market, 2016-2026 (USD Million)
5.3.4. Germany Nanorobotics Market, 2016-2026 (USD Million)
5.3.5. France Nanorobotics Market, 2016-2026 (USD Million)
5.3.6. Rest of Europe Nanorobotics Market, 2016-2026 (USD Million)
5.4. Asia Pacific Nanorobotics Market
5.4.1. Asia Pacific Nanorobotics Market, by Type, 2016-2026 (USD Million)
5.4.2. Asia Pacific Nanorobotics Market, by Applications, 2016-2026 (USD Million)
5.4.3. China Nanorobotics Market, 2016-2026 (USD Million)
5.4.4. Japan Nanorobotics Market, 2016-2026 (USD Million)
5.4.5. India Nanorobotics Market, 2016-2026 (USD Million)
5.4.6. Rest of Asia Pacific Nanorobotics Market, 2016-2026 (USD Million)
5.5. Latin America Nanorobotics Market
5.5.1. Latin America Nanorobotics Market, by Type, 2016-2026 (USD Million)
5.5.2. Latin America Nanorobotics Market, by Applications, 2016-2026 (USD Million)
5.5.3. Brazil Nanorobotics Market, 2016-2026 (USD Million)
5.5.4. Mexico Nanorobotics Market, 2016-2026 (USD Million)
5.5.5. Rest of Latin America Nanorobotics Market, 2016-2026 (USD Million)
5.6. Middle East & Africa Nanorobotics Market
5.6.1. Middle East & Africa Nanorobotics Market, by Type, 2016-2026 (USD Million)
5.6.2. Middle East & Africa Nanorobotics Market, by Applications, 2016-2026 (USD Million)
5.6.3. GCC Nanorobotics Market, 2016-2026 (USD Million)
5.6.4. Rest of Middle East & Africa Nanorobotics Market, 2016-2026 (USD Million)
Chapter 6 Competitive Intelligence
6.1. Top 5 Players Comparison
6.2. Market Positioning of Key Players, 2018
6.3. Market Players Mapping
6.3.1. By Type
6.3.2. By Applications
6.3.3. By Region
6.4. Strategies Adopted by Key Market Players
6.5. Recent Developments in the Market
6.5.1. Mergers & Acquisitions, Partnership, New Type Developments
Chapter 7 Company Profiles
7.1. Bruker
7.1.1. Bruker Overview
7.1.2. Bruker Types Portfolio
7.1.3. Bruker Financial Overview
7.1.4. Bruker News/Recent Developments
7.2. JEOL
7.2.1. JEOL Overview
7.2.2. JEOL Types Portfolio
7.2.3. JEOL Financial Overview
7.2.4. JEOL News/Recent Developments
7.3. Thermo Fisher Scientific
7.3.1. Thermo Fisher Scientific Overview
7.3.2. Thermo Fisher Scientific Types Portfolio
7.3.3. Thermo Fisher Scientific Financial Overview
7.3.4. Thermo Fisher Scientific News/Recent Developments
7.4. Ginkgo Bioworks
7.4.1. Ginkgo Bioworks Overview
7.4.2. Ginkgo Bioworks Types Portfolio
7.4.3. Ginkgo Bioworks Financial Overview
7.4.4. Ginkgo Bioworks News/Recent Developments
7.5. Oxford Instruments
7.5.1. Oxford Instruments Overview
7.5.2. Oxford Instruments Types Portfolio
7.5.3. Oxford Instruments Financial Overview
7.5.4. Oxford Instruments News/Recent Developments
7.6. EV Group
7.6.1. EV Group Overview
7.6.2. EV Group Types Portfolio
7.6.3. EV Group Financial Overview
7.6.4. EV Group News/Recent Developments
7.7. Imina Technologies
7.7.1. Imina Technologies Overview
7.7.2. Imina Technologies Types Portfolio
7.7.3. Imina Technologies Financial Overview
7.7.4. Imina Technologies News/Recent Developments
7.8. Toronto Nano Instrumentation
7.8.1. Toronto Nano Instrumentation Overview
7.8.2. Toronto Nano Instrumentation Types Portfolio
7.8.3. Toronto Nano Instrumentation Financial Overview
7.8.4. Toronto Nano Instrumentation News/Recent Developments
7.9. Klocke Nanotechnik
7.9.1. Klocke Nanotechnik Overview
7.9.2. Klocke Nanotechnik Types Portfolio
7.9.3. Klocke Nanotechnik Financial Overview
7.9.4. Klocke Nanotechnik News/Recent Developments
7.10. Kleindiek Nanotechnik
7.10.1. Kleindiek Nanotechnik Overview
7.10.2. Kleindiek Nanotechnik Types Portfolio
7.10.3. Kleindiek Nanotechnik Financial Overview
7.10.4. Kleindiek Nanotechnik News/Recent Developments
Chapter 8 Preface
8.1. Data Triangulation
8.2. Research Methodology
8.2.1. Phase I – Secondary Research
8.2.2. Phase II – Primary Research
8.2.3. Phase III – Expert Panel Review
8.2.4. Approach Adopted
8.2.4.1. Top-Down Approach
8.2.4.2. Bottom-Up Approach
8.2.5. Supply- Demand side
8.2.6. Breakup of the Primary Profiles


 Log in / Register


