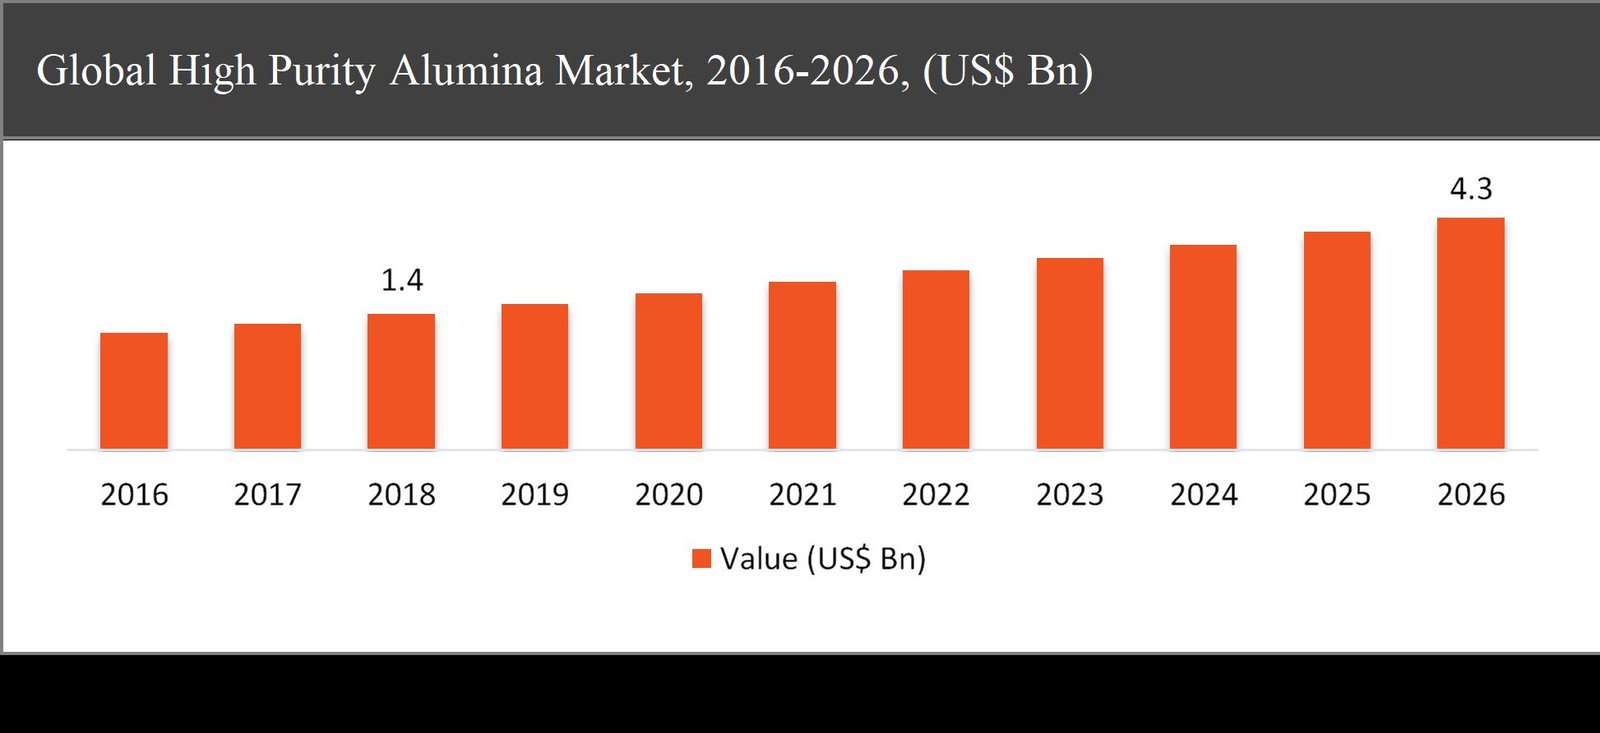
The global high purity alumina market was valued at USD 1.4 billion in 2018 and is expected to reach USD 4.3 billion in 2026, growing at a CAGR of 15.0% during the forecast period.
High-purity aluminium oxide is commonly referred to as HPA. High purity alumina is a high-value, high-yield and highly-demanded product, as it is a critical ingredient for the production of synthetic sapphire. Synthetic sapphire is usually used in the manufacture of LED light substrates, semiconductor wafers used in the electronics industry, and scratch-resistant sapphire glass used for wristwatch faces optical windows and smartphone components. In the production of synthetic sapphire, there is no replacement for HPA.
The growth of the high purity alumina market is primarily driven by the rising demand for high purity alumina from LED industries. Moreover, rising investment in end-use industries and the non-availability of substitutes of HPA also drives the growth of the global high purity alumina market. On the other hand, the high cost of production is creating a major hindrance to its market growth. However, high demand for high purity alumina in emerging economies and increasing applicability in the sapphire market is expected to create major growth opportunities during the forecast period.
High Purity Alumina Market Segmentation |
|
| By Purity Level | 1. 4N |
| 2. 5N | |
| 3. 6N | |
| By Application | 1. LED |
| 2. Semiconductor | |
| 3. Phosphor | |
| 4. Sapphire | |
| 5. Others | |
| By Region | 1. North America (US and Canada) |
| 2. Europe (UK, Germany, France and Rest of Europe) | |
| 3. Asia Pacific (China, Japan, India and Rest of Asia Pacific) | |
| 4. Latin America (Brazil, Mexico and Rest of Latin America) | |
| 5. Middle East & Africa (GCC and Rest of Middle East & Africa) | |
Based on the purity level, the 4N segment is expected to lead during the forecast period
Based on the purity level, the global high purity alumina market has been segmented into 4N, 5N, and 6N. The 4N segment is expected to lead and accounted for almost 55% market share in the global market in 2018. 4N grade alumina with a purity rate of 99.99% is the most commonly used product on the market due to lower production costs and easier availability of smelter grade alumina and low impurity of clay feedstock. 4N grade alumina is the most popular product in the market due to its properties like high mechanical strength and chemical resistance. The increased use of 4N grade in applications, including ultrafiltration and gas separation membranes, due to its enhanced chemical resistance and porous nature is expected to drive market growth over the forecast period.
The LED segment expected to grow at the fastest rate of 19.6% CAGR during the forecast period
Based on the application, the high purity alumina market has been segmented into LED, semiconductor, phosphor, sapphire, and others. The LED segment is expected to grow at the fastest rate of 19.6% CAGR during the forecast period. The segment is mainly driven by the emerging LED lightings market. LEDs are commonly used in traffic lights, LED-backlit LCDs, digital backlights and general lighting products. The introduction of strict government regulations on the manufacture and use of incandescent lights increased the adoption of LED lighting in both developed and developing countries, driving the demand of the high-purity alumina industry.
Asia-Pacific to dominate the high purity alumina market throughout the forecast period
Asia-Pacific accounted for nearly 34% share of the global high purity alumina market in 2018 and is expected to dominate the market throughout the forecast period followed by North America. Owing to the increase in domestic production of energy-efficient lightings like LEDs, the Asia Pacific is anticipated to lead the global market. The HPA market in China is estimated to have the fastest growth during the forecast period, due to a favorable economic environment and the need for technological advances in electronics products such as mobile phones and cameras.
Company Profiles and Competitive Intelligence:
The major players operating in the global high purity alumina market are Altech Chemicals Limited (Australia), Alcoa Inc. (New York), Orbite Technologies Inc. (Canada), Sumitomo Chemical Co., Ltd. (Japan), Baikowski (France), Nippon Light Metal Holdings Company, Ltd (Japan), Zibo Honghe Chemical Co. Ltd. (China), Sasol (South Africa), Xuan Cheng Jing Rui New Material Co. Ltd. (China), and Hebei Pengda Advanced Materials Technology Co., Ltd (China) among others.

Ask for free product review call with the author

Share your specific research requirements for a customized report

Request for due diligence and consumer centric studies

Request for study updates, segment specific and country level reports
Chapter 1 Executive Summary
1.1. Market Summary
1.1.1. Global High Purity Alumina Market, 2016-2026, (USD Million)
1.2. Market Snapshot: Global High Purity Alumina Market
1.3. Market Dynamics
1.4. Global High Purity Alumina Market, by Segment, 2018
1.4.1. Global High Purity Alumina Market, by Purity Level, 2018, (USD Million)
1.4.2. Global High Purity Alumina Market, by Application, 2018, (USD Million)
1.4.3. Global High Purity Alumina Market, by Region, 2018 (USD Million)
1.5. Premium Insights
1.5.1. High Purity Alumina Market In Developed Vs. Developing Economies, 2018 vs 2026
1.5.2. Global High Purity Alumina Market: Regional Life Cycle Analysis
Chapter 2 Market Dynamics
2.1. Market Overview
2.2. Market Drivers
2.2.1. Rising demand of from LED industries
2.2.2. Rising investment in end-use industries
2.3. Market Restraints
2.3.1. High cost for the production
2.4. Market Opportunities
2.4.1. Increasing demand from emerging economies
2.5. Industry Value Chain Analysis
2.6. Pricing Analysis
2.7. Porter’s Five Forces Analysis
Chapter 3 Global High Purity Alumina Market, by Purity Level
3.1. Market Overview, by Purity Level
3.1.1. Global High Purity Alumina Market, by Purity Level, 2016-2026 (USD Million)
3.1.2. Incremental Opportunity, by Purity Level, 2018
3.2. 4N
3.2.1. Global High Purity Alumina Market, by 4N, 2016-2026, (USD Million)
3.3. 5N
3.3.1. Global High Purity Alumina Market, by 5N, 2016-2026, (USD Million)
3.4. 6N
3.4.1. Global High Purity Alumina Market, by 6N, 2016-2026, (USD Million)
Chapter 4 Global High Purity Alumina Market, by Application
4.1. Market Overview, by Application
4.1.1. Global High Purity Alumina Market, by Application, 2016-2026 (USD Million)
4.1.2. Incremental Opportunity, by Application, 2018
4.2. LED
4.2.1. Global High Purity Alumina Market, by LED, 2016-2026, (USD Million)
4.3. Semiconductor
4.3.1. Global High Purity Alumina Market, by Semiconductor, 2016-2026, (USD Million)
4.4. Phosphor
4.4.1. Global High Purity Alumina Market, by Phosphor, 2016-2026, (USD Million)
4.5. Sapphire
4.5.1. Global High Purity Alumina Market, by Sapphire, 2016-2026, (USD Million)
4.6. Others
4.6.1. Global High Purity Alumina Market, by Others, 2016-2026, (USD Million)
Chapter 5 Global High Purity Alumina Market, by Region
5.1. Market Overview, by Region
5.1.1. Global High Purity Alumina Market, by Region, 2016-2026, (USD Million)
5.2. Attractive Investment Opportunity, by Region, 2018
5.3. North America High Purity Alumina Market
5.3.1. North America High Purity Alumina Market, by Purity Level, 2016-2026 (USD Million)
5.3.2. North America High Purity Alumina Market, by Application, 2016-2026 (USD Million)
5.3.3. United States High Purity Alumina Market, 2016-2026 (USD Million)
5.3.4. Canada High Purity Alumina Market, 2016-2026 (USD Million)
5.4. Europe High Purity Alumina Market
5.4.1. Europe High Purity Alumina Market, by Purity Level, 2016-2026 (USD Million)
5.4.2. Europe High Purity Alumina Market, by Application, 2016-2026 (USD Million)
5.4.3. United Kingdom High Purity Alumina Market, 2016-2026 (USD Million)
5.4.4. Germany High Purity Alumina Market, 2016-2026 (USD Million)
5.4.5. France High Purity Alumina Market, 2016-2026 (USD Million)
5.4.6. Rest of Europe High Purity Alumina Market, 2016-2026 (USD Million)
5.5. Asia Pacific High Purity Alumina Market
5.5.1. Asia Pacific High Purity Alumina Market, by Purity Level, 2016-2026 (USD Million)
5.5.2. Asia Pacific High Purity Alumina Market, by Application, 2016-2026 (USD Million)
5.5.3. China High Purity Alumina Market, 2016-2026 (USD Million)
5.5.4. Japan High Purity Alumina Market, 2016-2026 (USD Million)
5.5.5. India High Purity Alumina Market, 2016-2026 (USD Million)
5.5.6. Rest of Asia Pacific High Purity Alumina Market, 2016-2026 (USD Million)
5.6. Latin America High Purity Alumina Market
5.6.1. Latin America High Purity Alumina Market, by Purity Level, 2016-2026 (USD Million)
5.6.2. Latin America High Purity Alumina Market, by Application, 2016-2026 (USD Million)
5.6.3. Brazil High Purity Alumina Market, 2016-2026 (USD Million)
5.6.4. Mexico High Purity Alumina Market, 2016-2026 (USD Million)
5.6.5. Rest of Latin America High Purity Alumina Market, 2016-2026 (USD Million)
5.7. Middle East & Africa High Purity Alumina Market
5.7.1. Middle East & Africa High Purity Alumina Market, by Purity Level, 2016-2026 (USD Million)
5.7.2. Middle East & Africa High Purity Alumina Market, by Application, 2016-2026 (USD Million)
5.7.3. GCC High Purity Alumina Market, 2016-2026 (USD Million)
5.7.4. Rest of Middle East & Africa High Purity Alumina Market, 2016-2026 (USD Million)
Chapter 6 Competitive Intelligence
6.1. Top 5 Players Comparison
6.2. Market Positioning of Key Players, 2018
6.3. Market Players Mapping
6.3.1. By Purity Level
6.3.2. By Application
6.3.3. By Region
6.4. Strategies Adopted by Key Market Players
6.5. Recent Developments in the Market
6.5.1. Mergers & Acquisitions, Partnership, New Type Developments
Chapter 7 Company Profiles
7.1. Altech Chemicals Limited
7.1.1. Altech Chemicals Limited Overview
7.1.2. Altech Chemicals Limited Product Portfolio
7.1.3. Altech Chemicals Limited Financial Overview
7.1.4. Altech Chemicals Limited News/Recent Developments
7.2. Alcoa Inc.
7.2.1. Alcoa Inc. Overview
7.2.2. Alcoa Inc. Product Portfolio
7.2.3. Alcoa Inc. Financial Overview
7.2.4. Alcoa Inc. News/Recent Developments
7.3. Orbite Technologies Inc.
7.3.1. Orbite Technologies Inc. Overview
7.3.2. Orbite Technologies Inc. Product Portfolio
7.3.3. Orbite Technologies Inc. Financial Overview
7.3.4. Orbite Technologies Inc. News/Recent Developments
7.4. Sumitomo Chemical Co., Ltd.
7.4.1. Sumitomo Chemical Co., Ltd. Overview
7.4.2. Sumitomo Chemical Co., Ltd. Product Portfolio
7.4.3. Sumitomo Chemical Co., Ltd. Financial Overview
7.4.4. Sumitomo Chemical Co., Ltd. News/Recent Developments
7.5. Bukowski
7.5.1. Bukowski Overview
7.5.2. Bukowski Product Portfolio
7.5.3. Bukowski Financial Overview
7.5.4. Bukowski News/Recent Developments
7.6. Nippon Light Metal Holdings Company, Ltd
7.6.1. Nippon Light Metal Holdings Company, Ltd Overview
7.6.2. Nippon Light Metal Holdings Company, Ltd Product Portfolio
7.6.3. Nippon Light Metal Holdings Company, Ltd Financial Overview
7.6.4. Nippon Light Metal Holdings Company, Ltd News/Recent Developments
7.7. Zibo Honghe Chemical Co. Ltd.
7.7.1. Zibo Honghe Chemical Co. Ltd. Overview
7.7.2. Zibo Honghe Chemical Co. Ltd. Product Portfolio
7.7.3. Zibo Honghe Chemical Co. Ltd. Financial Overview
7.7.4. Zibo Honghe Chemical Co. Ltd. News/Recent Developments
7.8. Sasol
7.8.1. Sasol Overview
7.8.2. Sasol Product Portfolio
7.8.3. Sasol Financial Overview
7.8.4. Sasol News/Recent Developments
7.9. Xuan Cheng Jing Rui New Material Co. Ltd.
7.9.1. Xuan Cheng Jing Rui New Material Co. Ltd. Overview
7.9.2. Xuan Cheng Jing Rui New Material Co. Ltd. Product Portfolio
7.9.3. Xuan Cheng Jing Rui New Material Co. Ltd. Financial Overview
7.9.4. Xuan Cheng Jing Rui New Material Co. Ltd. News/Recent Developments
7.10. Hebei Pengda Advanced Materials Technology Co., Ltd.
7.10.1. Hebei Pengda Advanced Materials Technology Co., Ltd. Overview
7.10.2. Hebei Pengda Advanced Materials Technology Co., Ltd. Product Portfolio
7.10.3. Hebei Pengda Advanced Materials Technology Co., Ltd. Financial Overview
7.10.4. Hebei Pengda Advanced Materials Technology Co., Ltd. News/Recent Developments
Chapter 8 Preface
8.1. Data Triangulation
8.2. Research Methodology
8.2.1. Phase I – Secondary Research
8.2.2. Phase II – Primary Research
8.2.3. Phase III – Expert Panel Review
8.2.4. Approach Adopted
8.2.4.1. Top-Down Approach
8.2.4.2. Bottom-Up Approach
8.2.5. Supply- Demand side
8.2.6. Breakup of the Primary Profiles


 Log in / Register


