Global AR VR in Retail Market Ecosystem By Raw Material; By Components; By Product, Parts & Devices; By Services & Solutions; By Application (3D modelling/ Design, Training, Others); By Region

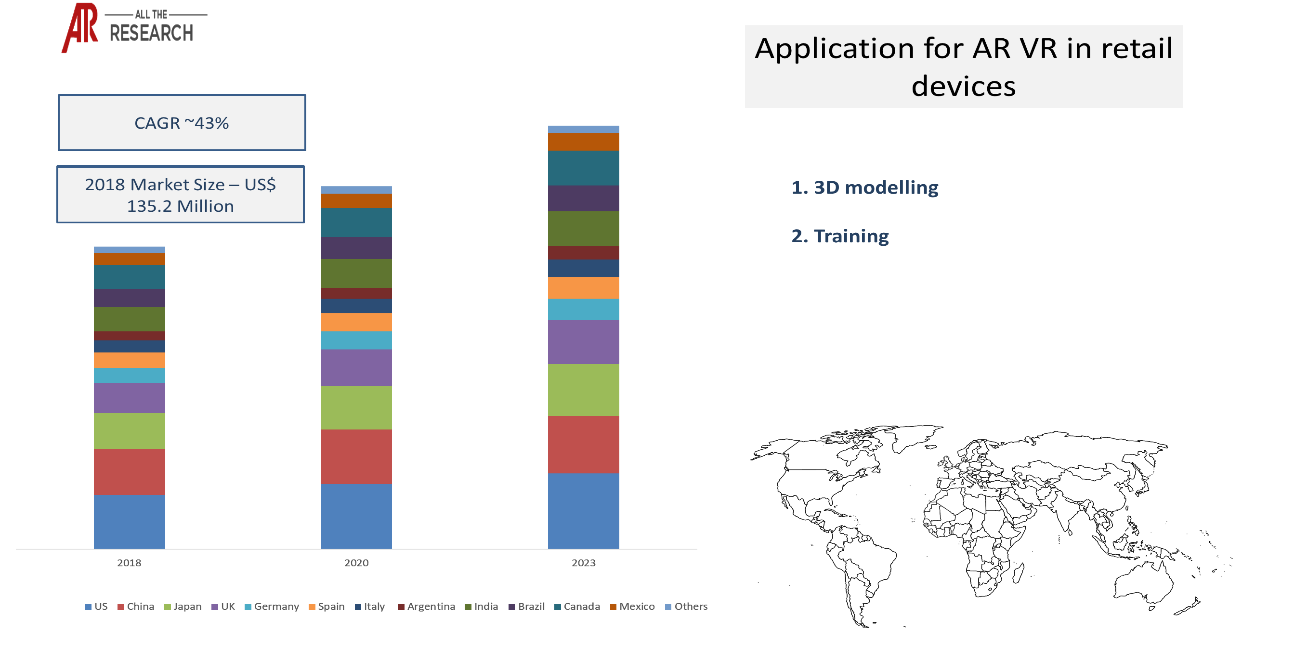
The global AR VR in Retail Market Ecosystem was valued at US$ 135.2 Mn in 2018 and is expected to reach US$ XX Mn with a CAGR of 43% during the forecast period. The increasing use of AR VR by retail companies such as IKEA, Houzz, Walmart, and others, has been driving the growth of the AR VR retail market in recent years. IKEA uses AR for home goods and furniture retailing, allowing customers to manipulate and place catalog items at scale in consumer homes.

Changing lifestyles and increasing working-class populations are increasing the demand for virtual reality shopping. In order to meet this changing demand, companies such as Amazon and Walmart are introducing augmented reality-based applications for enhancing customer experience. Moreover, companies are also focusing on using virtual reality for conveying information about products while shopping. For example, the partnership between Kraft, a prepackaged food retailer, Walmart and Blippar, an application provider, for providing digital receipts to customers through AR.

Ecosystem Snapshot: AR VR in Retail Market Overview

AR VR in Retail Ecosystem Snapshot

The handheld devices segment accounted for US$ XX Mn in 2018 and is expected to grow with a CAGR of XX% during the forecast period. The increasing use of handheld devices by retailers for promoting their products is driving the growth of the segment. AR VR is used for in-store engagement to assist customers in navigating the store and to give them a virtual feel of products. For instance, Genius app of Loreal allows users to apply makeup products such as eyeliner and lipstick on their face, with smartphone cameras acting as a smart mirror. The application is gaining traction across the globe, and it has been downloaded for more than 16 million times, according to the report provided by Loreal in 2017.

AR VR in retail is also in demand among customers due to its ability to provide customization to users. The AR technology is used by Dulux Color app in its color view feature that enables users to visualize the effect of color on their walls by using smartphones. This, in turn, is driving the demand for handheld devices in AR VR retailing.
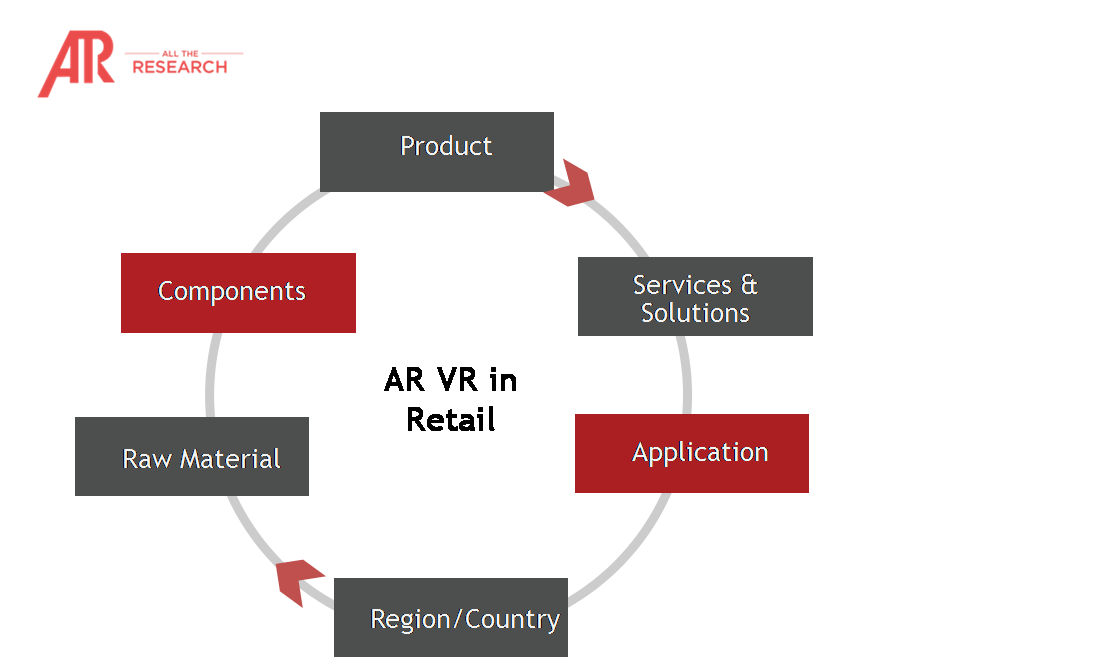
AR VR in Retail Market Ecosystem: Segmentation

Raw Materials

Components

Products, Parts & Devices

Software & Services

Applications

Silicon

Camera

Handheld Devices

Documentation

3D Modelling/ Design- Shopping

GaN

Sensors

AR Screen

Visualization

Training

SiC

IMU

Head-Mounted Displays

3D modeling


Glass

Displays

Smart Glass

Navigation


Plastic

Processor


Workflow optimization


Metals

Memory


Others


Others

Graphics


Audio


Module


Others


Global AR VR in Retail Market Ecosystem:

Based on regions, North America dominated the market in 2018 and is expected to witness similar trends in the coming years. The presence of major players such as Loreal, Walmart, Ulta Beauty, and others is driving the growth of AR VR in the retail market ecosystem in the region. Asia Pacific is expected to grow at the fastest pace with a CAGR of XX% during the forecast period. According to a market study in 2016, 28% of Australian retailers are expected to adopt VR in the coming years, which is expected to drive the growth of the VR market in the Asia Pacific region during the forecast period.

The major players in the market are mainly focusing on mergers and acquisitions for strengthening their presence in the market. For instance, in March 2018, Loreal announced the acquisition of Modiface that offers beauty try-on simulations on live video, which include photorealistic hairstyle, hair color, and makeup stimulation. Additionally, in November 2018, Ulta Beauty, a beauty retailer, announced the acquisition of GlamST, a provider of 3D virtual makeup technology, and due to this, users will be able to try makeup via mobile. 

AR VR in Retail Ecosystem: Market Statistics Glimpse

AR VR in Retail Ecosystem- Market Statistics Glimpse

There are many trends that are having an impact on the market forecast. These, when evaluated from a company’s perspective, can drive growth. Our numerous consulting projects have generated sizeable synergies across all regions and all sizes of companies.

The Major Players Operating in the Global AR VR in Retail Market Ecosystem are as follows:

Company

Ecosystem Positioning

Total Revenue

Industry

Region

Microsoft

Product Manufacture

$110.4 Billion


Global

Google LLC


Product Manufacture

$136.22 Billion


Global

Lenovo


Product Manufacture

$14 Billion


Global

HTC Corporation

Product Manufacture

$0.73 Billion


Global

Facebook

Product Manufacture

$55 Billion


Global


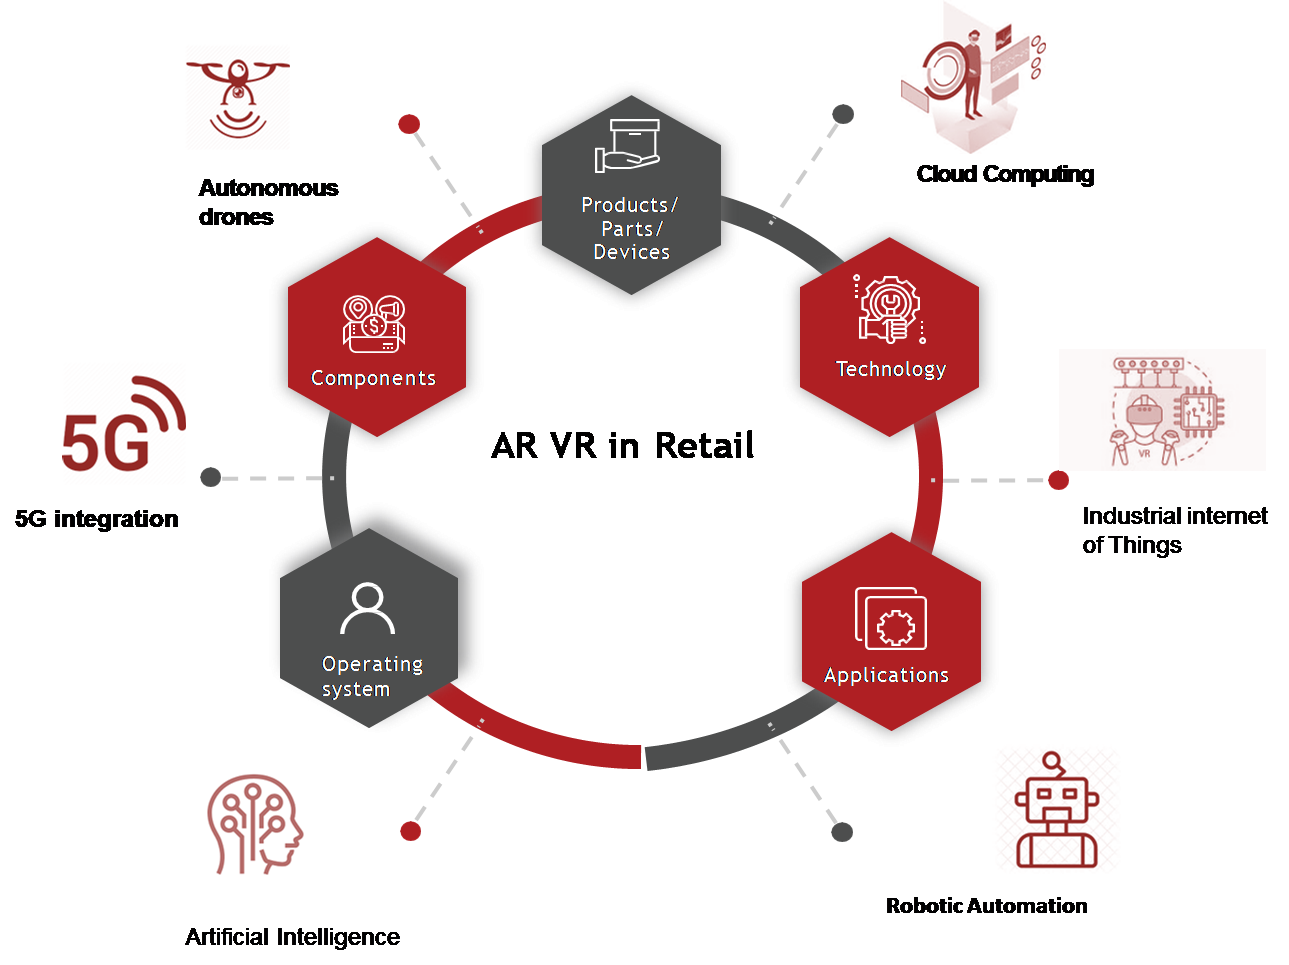
Very few markets have interconnectivity with other markets like AR VR. Our Interconnectivity module focuses on the key nodes of heterogenous markets in detail. Autonomous drones, cloud computing, industrial internet of things, robotic automation, artificial intelligence, and 5G integration markets are some of our key researched markets

AR VR in Retail Market Ecosystem Major Interconnectivity

AR VR in Retail Ecosystem Major Interconnectivities

Global AR VR in Retail Market Ecosystem: Key Trends

Trends

Application

Augmented reality applications are used by jewelry shops to enable customers to try jewelry virtually. Smart mirrors are created by using iPad that generate catalogues of thousands of earrings across the stores as per the customer age.

Shopping  

Interactive retail display is used in retail stores to enable customers to try new clothes. This digital technology provides customers a new immersive experience in retail stores.

Shopping


Related Reports

Need specific market information ?

Ask for free product review call with the author

Share your specific research requirements for a customized report

Request for due diligence and consumer centric studies

Request for study updates, segment specific and country level reports

Ecosystem Report – Table of Content

  1. Introduction
    1. Global AR VR in retail ecosystem Definition
    2. Scope of study 
    3. Annual SaaS
  2. Executive Summary
    1. Global Market Segmentation
    2. Global Market Overview
      1. Mega Growth Drivers
      2. Major Growth Blockers
    3. Global Market Statistics
      1. By Investment
        1. AR VR in Retail Ecosystem Industry Player
        2. Investment Companies
      2. By Market Revenue / Shipments/ Price Points                        
    4. Mega Trends
    5. Competitive Landscape
      1. SWOT
      2. PEST
      3. Company Ranking
    6. Market Attractiveness
      1. By Segment Level
      2. By Geography (Region/Country)
    7. Interconnectivity
      1. Allied/Interconnected Markets
      2. Allied/Interconnected Technologies
      3. Allied/Interconnected Applications
      4. Allied/Interconnected End Users

AR VR in Retail Ecosystem Positioning

  1. Global AR VR in Retail Ecosystem Snapshot
    1. AR VR in Retail Ecosystem Broad Heads
      1. Demand Side
    2. Supply Side
  2. Global AR VR in Retail Ecosystem Segmentation
      1. By Raw Material
        1. Silicon
        2. GaN
        3. SiC
        4. Glass
        5. Plastic
        6. Metals
        7. Others
      2. By Components
        1. Camera
        2. Sensors
        3. IMU
        4. Displays
        5. Processor
        6. Memory
        7. Graphics
        8. Audio
        9. Module
        10. Others
      3. By Product, Parts & Devices
          1. Handheld Devices
          2. AR Screens
          3. Head Mounted Displays
          4. Smart Glass
      4. By Software & Services  
        1. Documentation
        2. Visualization
        3. 3D Modelling
        4.  Navigation
        5. Workflow Optimization
        6. Others
      5. By Application
        1. 3D Modelling/ Design- Shopping
        2. Training
      6. Geographic Overview
        1. North America
          1. U.S.
          2. Canada
          3. Mexico
        2. Europe
          1. U.K.
          2. Germany
          3. Italy
          4. Spain
          5. France
          6. Rest of Europe
        3. APAC
          1. India
          2. Japan
          3. China
          4. South Korea
          5. Taiwan
          6. Rest of APAC
        4. RoW
          1. MEA
          2. LATAM
  3. Competitive Landscape Mapping by Ecosystem Positioning
    1. Company by each node
    2. Vendor Landscaping
    3. Ecosystem Level Analysis
    4. Global AR VR in Retail Ecosystem Broad Heads
  4. Competitive Landscape Mapping by Ecosystem Positioning
    1. Company by each node
    2. Vendor Landscaping

AR VR in Retail Ecosystem Trend Analysis

  1. Global AR VR in Retail Ecosystem Trends
    1. Trend Mapping
      1. Trend Description
      2. Trend Evaluation
        1. Impact
        2. Importance
        3. Remarks
      3. Trend Outlook (Short, Mid, Long Term)
      4. Trend Company Mapping
      5. Related AR VR in retail ecosystem Mapping
      6. Trend Region/Country Mapping

AR VR in Retail Ecosystem Regulatory Analysis

  1. Overview
    1. Regulatory Mapping
    2. Regulatory Impact
    3. Regulatory Interlinkage

AR VR in retail ecosystem Sizing, Volume and ASP Analysis & Forecast

  1. Global AR VR in Retail Ecosystem Sizing & Volume
    1. Cross-segmentation
    2. Global AR VR in Retail Ecosystem Market Sizing and Forecast
    3. Global AR VR in Retail Ecosystem Volume Analysis
    4. Average Selling Price Analysis
    1. Global AR VR in Retail Ecosystem Growth Analysis

AR VR in Retail Ecosystem Competitive Intelligence

  1. Competitive Intelligence
    1. Top Industry Players vs Trend Tagging
        1. Importance
        2. Trend Nature (Positive/ Negative)
        3. Value
        4. Interconnectivity for each vendor
    2. Global AR VR in retail ecosystem Share Analysis
        1. By Each Node
    3. Strategies Adopted by Global AR VR in Retail Ecosystem participants
        1. Global AR VR in Retail Ecosystem Strategies
          1. New product launch Strategies
          2. Geographic Expansion Strategies
          3. Product-line Expansion Strategies
          4. Operational / Efficiency building Strategies
          5. Other Strategies

AR VR in Retail Ecosystem Company Profiles

  1. Company Profiles (Total available company profiles for this market are around 103, this is sample list of companies. Please write us at contact@alltheresearch.com for details)
    1. Microsoft
      1. Company Fundamentals
      2. Subsidiaries list
      3. Share Holding Pattern
      4. Key Employees and Board of Directors
      5. Financial Analysis
        1. Financial Summary
        2. Ratio Analysis
        3. Valuation Metrics
      6. Product & Services
      7. Client & Strategies
      8. Ecosystem Presence
      9. SWOT
      10. Trends Mapping
      11. Analyst Views
    2. Google LLC
    3. Lenovo
    4. HTC Corporation
    5. Oculus
    6. Samsung Electronics Co. Ltd
    7. Sony Corporation
    8. LG Electronics
    9. Apple
    10. Mi
    11. Motorola
    12. Broadcom
    13. Himax
    14. MediaTek
    15. AMD
    16. Nvidia
    17. Zugara
    18. OBSESS
    19. Blippar
    20. Strata Mixed Reality

AR VR in Retail Ecosystem Developments

  1.  Market Developments
    1. AR VR in Retail Ecosystem Events & Rationale
    2. R&D, Technology and Innovation
    3. Business & Corporate advancements
    4. M&A, JVs/Partnerships
    5.  Political, Macro-economic, Regulatory
    6.  Awards & Recognition
    7. Others

Customizations

  1. Ask for Customization
    1. Sensitivity Analysis
    2. TAM SAM SOM Analysis
    3. Other Customization
  2. Appendix
    1. Sources
    2. Assumptions
    3. Contact

Choose License

License Type
Ask for Customization

Why Choose AllTheResearch?

  • Monthly market updates for 6 months
  • Online access of reports
  • Options to buy sections of report
  • Critically analysed research on Quadrant Positioning of your company.
  • Syndicated report along with a supplementary report with objective-based study
  • Get profiled in the reports.Expanding your visibility across our network of readers and viewers
  • We provide local market data in local language on request
  • A complementary co-branded white paper
  • Flat consulting fee based exclusive studies. Consult at the price of syndicate
  • Access to expert team for free transaction advisory service.
Speak to Analyst

Quick Inquiry

Follow Us

Choose License

License Type
Ask for Customization