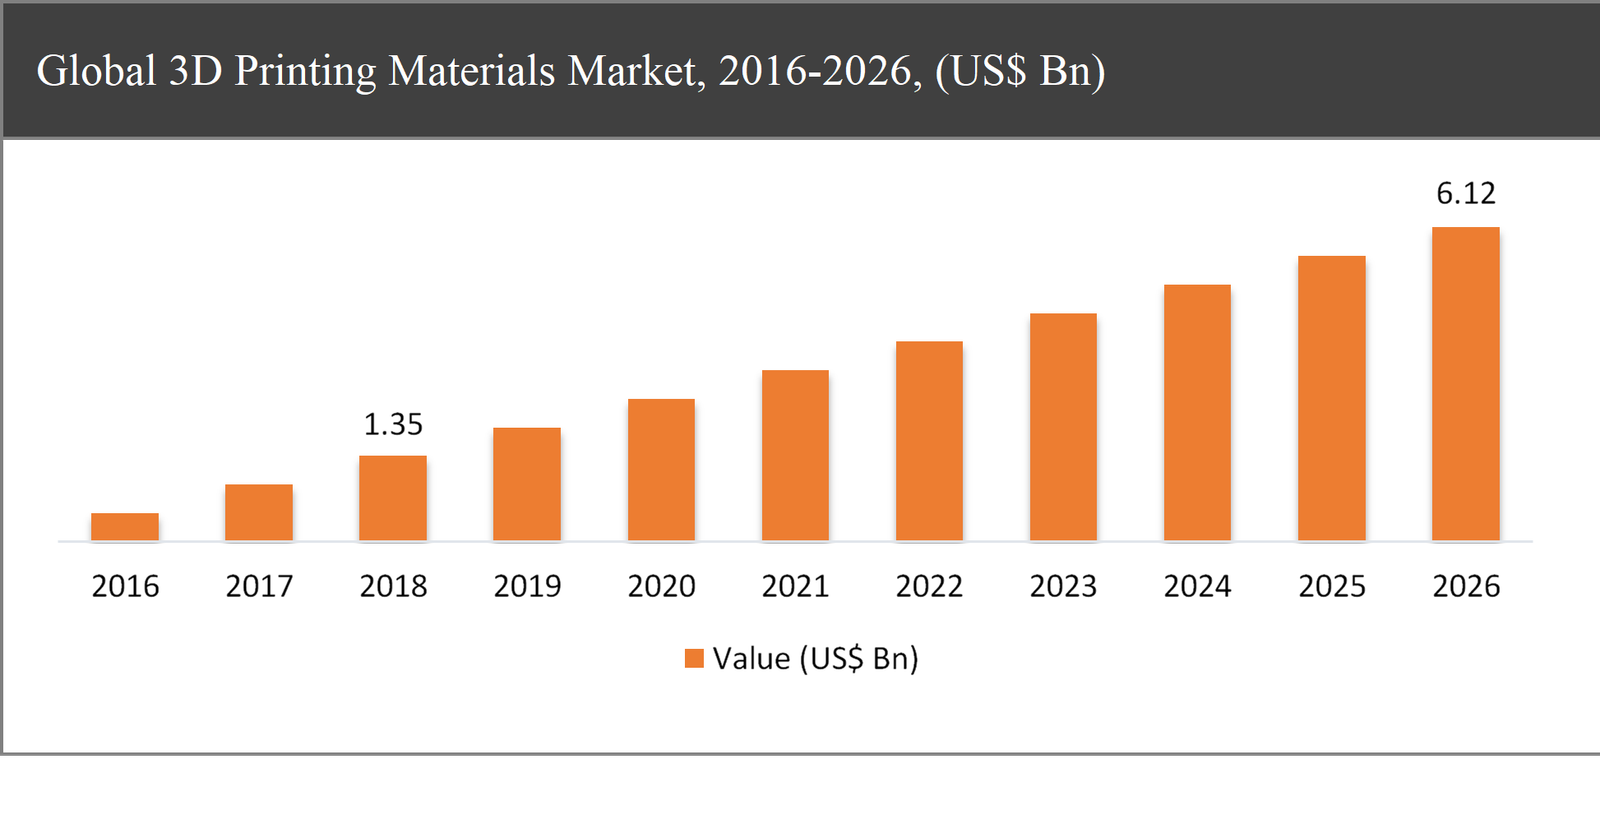
The global 3D printing materials market was valued at USD 1.35 billion in 2018 and is expected to reach USD 6.12 billion in 2026, growing at a CAGR of 20.6% during the forecast period.
3D printing is also referred to as desktop fabrication or additive manufacturing and allows printing almost any desired product in a short time. It has a big influence in fashion, engineering and laboratory products. Additionally, 3D printing also assists in the survival of birds. 3D printing replaced the Eagle’s beak by using photopolymer solution.
3D Printing Materials Market Segmentation |
|
| By Type | 1. Plastic |
| 2. Metal | |
| 3. Ceramic | |
| 4. Others | |
| By Form | 1. Filament |
| 2. Powder | |
| 3. Liquid | |
| By End-user | 1. Consumer Goods |
| 2. Automotive | |
| 3. Construction | |
| 4. Aerospace & Defense | |
| 5. Helthcare | |
| 6. Others | |
| By Region | 1. North America (US and Canada) |
| 2. Europe (UK, Germany, France and Rest of Europe) | |
| 3. Asia Pacific (China, Japan, India and Rest of Asia Pacific) | |
| 4. Latin America (Brazil, Mexico and Rest of Latin America) | |
| 5. Middle East & Africa (GCC and Rest of Middle East & Africa) | |
The growth of the 3D Printing Materials market is primarily driven by the growing demand of 3D printing materials in Aerospace and Automotive industry and growing government initiatives for the adoption of the 3D printing in various sectors such as Healthcare. 3D printing assists in reducing the cost acquire for hiring skilled and trained engineers to operate the printers. Whereas, the cost of acquiring the molding machines are higher than tradition extrusion machines. Photopolymer materials are eco-friendly and produce less waste as it can work without any volatile solvent in the manufacturing process, thus creating a huge demand for 3D printing that propels the market growth during the forecast period.
Based on the type, the plastic is projected to exhibit the fastest growth in the market during the forecast period
Based on the type, the market is segmented into plastic, metal, ceramic and others. Among these type, the plastic is expected to register the CAGR of around 24% in the 3D printing materials market during the forecast period. The growth is accredited to the growing application of the ceramic material printed accessories in the automotive industry. The various plastics such as ASA is selected for 3D printing material due to high strength, little warp and ability to resist UV. This member of thermoplastic resin family is widely penetrating new fields and domains such as 3D printing which increase the demand for plastics material in automotive industry extensively.
Based on the foam, the filament segment accounted for the largest share of nearly 55% in the market
Based on the form, the market has been segmented into filament, powder, and liquid. Moreover, the filament segment accounts for the largest share in terms of value and volume of nearly 55% in the market and is expected to grow over the forecast period.
Automotive to dominate in the market during the forecast period
Based on the end-user, the global 3D printing materials market is segmented into consumer goods, automotive, construction, aerospace and defense, healthcare and others. Among these end-users of markers, the automotive attains the major share in the market. One of the most innovative applications of 3D printing techniques in the present scenario includes automotive. The automotive industry is a good example of how additive manufacturing drives efficiencies and productivity from design to manufacturing floor. The production of individual parts can be a tedious method for an automobile company. With the help of 3D printer, the manufacturer can print the fragments on-demand, thus saving possessions and producing less waste.
North America to dominate the 3D printing materials market during the forecast period
North America accounts to hold a dominant position and registered almost 42% share in the global 3D printing materials market in 2018 and further expected its dominance during the forecast period. The region has a significant market of automotive, consumer electronics, home appliances, sports, building and construction and packaging market due to which a noteworthy market can be expected during the forecast. Moreover, the increasing trends f 3D printing I healthcare and Aerospace industry that further propels the market in the region.
Company Profiles and Competitive Intelligence:
The major players operating in the global 3D Printing Materials market are Arkema SA (France), 3D Systems Corporation (US), Materialise NV (Belgium), Evonik Industries AG (Germany), and General Electric Co. (US) Stratasys, Ltd. (US), and among others.

Ask for free product review call with the author

Share your specific research requirements for a customized report

Request for due diligence and consumer centric studies

Request for study updates, segment specific and country level reports
Chapter 1 Executive Summary
1.1. Market Summary
1.1.1. Global 3D Printing Materials Market, 2019-2026, (USD Million)
1.2. Market Snapshot: Global 3D Printing Materials Market
1.3. Market Dynamics
1.4. Global 3D Printing Materials Market, by Segment, 2018
1.4.1. Global 3D Printing Materials Market, by Type, 2018, (USD Million)
1.4.2. Global 3D Printing Materials Market, by Form, 2018, (USD Million)
1.4.3. Global 3D Printing Materials Market, by End-User, 2018, (USD Million)
1.4.4. Global 3D Printing Materials Market, by Region, 2018 (USD Million)
1.5. Premium Insights
1.5.1. 3D Printing Materials Market In Developed Vs. Developing Economies, 2018 vs 2026
1.5.2. Global 3D Printing Materials Market: Regional Life Cycle Analysis
Chapter 2 Market Dynamics
2.1. Market Overview
2.2. Market Drivers
2.2.1. Growth in demand across automotive and aerospace & defense industries
2.2.2. Rise in government initiatives and schemes to increase the adoption of 3D printing
2.3. Market Restraints
2.3.1. High material cost associated with the 3D printing materials
2.4. Market Opportunities
2.4.1. Adoption of 3D printing technology in home printing
2.4.2. Growth in demand from various end-use industries
2.5. Porter’s Five Forces Analysis
Chapter 3 Global 3D Printing Materials Market, by Type
3.1. Market Overview, by Type
3.1.1. Global 3D Printing Materials Market, by Country, 2019-2026 (USD Million)
3.1.2. Incremental Opportunity, by Type, 2018
3.2. Plastic
3.2.1. Global 3D Printing Market, by Plastic, 2016-2026, (USD Million)
3.3. Metal
3.3.1. Global 3D Printing Market, by Metal, 2016-2026, (USD Million)
3.4. Ceramic
3.4.1. Global 3D Printing Market, by Ceramic, 2016-2026, (USD Million)
3.5. Others
3.5.1. Global 3D Printing Market, by Others, 2016-2026, (USD Million)
Chapter 4 Global 3D Printing Materials Market, by Form
4.1. Market Overview, by Form
4.1.1. Global 3D Printing Materials Market, by Form, 2019-2026 (USD Million)
4.1.2. Incremental Opportunity, by Form, 2018
4.2. Filament
4.2.1. Global 3D Printing Market, by Filament, 2016-2026, (USD Million)
4.3. Powder
4.3.1. Global 3D Printing Market, by Powder, 2016-2026, (USD Million)
4.4. Liquid
4.4.1. Global 3D Printing Market, by Liquid, 2016-2026, (USD Million)
Chapter 5 Global 3D Printing Materials Market, by End-User
5.1. Market Overview, by End-User
5.1.1. Global 3D Printing Materials Market, by End-User, 2019-2026 (USD Million)
5.1.2. Incremental Opportunity, by End-User, 2018
5.2. Consumer Goods
5.2.1. Global 3D Printing Market, by Consumer Goods, 2016-2026, (USD Million)
5.3. Automotive
5.3.1. Global 3D Printing Market, by Automotive, 2016-2026, (USD Million)
5.4. Construction
5.4.1. Global 3D Printing Market, by Construction, 2016-2026, (USD Million)
5.5. Aerospace and Defense
5.5.1. Global 3D Printing Market, by Aerospace and Defense, 2016-2026, (USD Million)
5.6. Healthcare
5.6.1. Global 3D Printing Market, by Healthcare, 2016-2026, (USD Million)
5.7. Others
5.7.1. Global 3D Printing Market, by Others, 2016-2026, (USD Million)
Chapter 6 Global 3D Printing Materials Market, by Region
6.1. Market Overview, by Region
6.1.1. Global 3D Printing Materials Market, by Region, 2019-2026, (USD Million)
6.2. Attractive Investment Opportunity, by Region, 2018
6.3. North America 3D Printing Materials Market
6.3.1. North America 3D Printing Materials Market, by Type, 2019-2026 (USD Million)
6.3.2. North America 3D Printing Materials Market, by Foam, 2019-2026 (USD Million)
6.3.3. North America 3D Printing Materials Market, by End-User, 2019-2026 (USD Million)
6.3.4. United States 3D Printing Materials Market, 2019-2026 (USD Million)
6.3.5. Canada 3D Printing Materials Market, 2019-2026 (USD Million)
6.4. Europe 3D Printing Materials Market
6.4.1. Europe 3D Printing Materials Market, by Type, 2019-2026 (USD Million)
6.4.2. Europe 3D Printing Materials Market, by Foam, 2019-2026 (USD Million)
6.4.3. Europe 3D Printing Materials Market, by End-User, 2019-2026 (USD Million)
6.4.4. United Kingdom 3D Printing Materials Market, 2019-2026 (USD Million)
6.4.5. Germany 3D Printing Materials Market, 2019-2026 (USD Million)
6.4.6. France 3D Printing Materials Market, 2019-2026 (USD Million)
6.4.7. Rest of Europe 3D Printing Materials Market, 2019-2026 (USD Million)
6.5. Asia Pacific 3D Printing Materials Market
6.5.1. Asia Pacific 3D Printing Materials Market, by Type, 2019-2026 (USD Million)
6.5.2. Asia Pacific 3D Printing Materials Market, by Foam, 2019-2026 (USD Million)
6.5.3. Asia Pacific 3D Printing Materials Market, by End-User, 2019-2026 (USD Million)
6.5.4. China 3D Printing Materials Market, 2019-2026 (USD Million)
6.5.5. Japan 3D Printing Materials Market, 2019-2026 (USD Million)
6.5.6. India 3D Printing Materials Market, 2019-2026 (USD Million)
6.5.7. Rest of Asia Pacific 3D Printing Materials Market, 2019-2026 (USD Million)
6.6. Latin America 3D Printing Materials Market
6.6.1. Latin America 3D Printing Materials Market, by Type, 2019-2026 (USD Million)
6.6.2. Latin America 3D Printing Materials Market, by Foam, 2019-2026 (USD Million)
6.6.3. Latin America 3D Printing Materials Market, by End-User, 2019-2026 (USD Million)
6.6.4. Brazil 3D Printing Materials Market, 2019-2026 (USD Million)
6.6.5. Mexico 3D Printing Materials Market, 2019-2026 (USD Million)
6.6.6. Rest of Latin America 3D Printing Materials Market, 2019-2026 (USD Million)
6.7. Middle East & Africa 3D Printing Materials Market
6.7.1. Middle East & Africa 3D Printing Materials Market, by Type, 2019-2026 (USD Million)
6.7.2. Middle East & Africa 3D Printing Materials Market, by Foam, 2019-2026 (USD Million)
6.7.3. Middle East & Africa 3D Printing Materials Market, by End-User, 2019-2026 (USD Million)
6.7.4. GCC 3D Printing Materials Market, 2019-2026 (USD Million)
6.7.5. Rest of Middle East & Africa 3D Printing Materials Market, 2019-2026 (USD Million)
Chapter 7 Competitive Intelligence
7.1. Top 5 Players Comparison
7.2. Market Positioning of Key Players, 2018
7.3. Market Players Mapping
7.3.1. By Type
7.3.2. By Form
7.3.3. By End-User
7.3.4. By Region
7.4. Strategies Adopted by Key Market Players
7.5. Recent Developments in the Market
7.5.1. Mergers & Acquisitions, Partnership, New Type Developments
Chapter 8 Company Profiles
8.1. 3D Systems Corporation
8.1.1. 3D Systems Corporation Overview
8.1.2. 3D Systems Corporation Product Portfolio
8.1.3. 3D Systems Corporation Financial Overview
8.1.4. 3D Systems Corporation News/Recent Developments
8.2. Arkema S.A.
8.2.1. Arkema S.A. Overview
8.2.2. Arkema S.A. Product Portfolio
8.2.3. Arkema S.A. Financial Overview
8.2.4. Arkema S.A. News/Recent Developments
8.3. Royal Dsm N.V.
8.3.1. Royal Dsm N.V. Overview
8.3.2. Royal Dsm N.V. Product Portfolio
8.3.3. Royal Dsm N.V. Financial Overview
8.3.4. Royal Dsm N.V. News/Recent Developments
8.4. the Exone Company
8.4.1. the Exone Company. Overview
8.4.2. the Exone Company. Product Portfolio
8.4.3. the Exone Company. Financial Overview
8.4.4. the Exone Company. News/Recent Developments
8.5. Stratasys, Ltd.
8.5.1. Stratasys, Ltd. Overview
8.5.2. Stratasys, Ltd. Product Portfolio
8.5.3. Stratasys, Ltd. Financial Overview
8.5.4. Stratasys, Ltd. News/Recent Developments
8.6. General Electric Co.
8.6.1. General Electric Co. Overview
8.6.2. General Electric Co. Product Portfolio
8.6.3. General Electric Co. Financial Overview
8.6.4. General Electric Co. News/Recent Developments
8.7. Eos GmbH Electro Optical Systems
8.7.1. Eos GmbH Electro Optical Systems Overview
8.7.2. Eos GmbH Electro Optical Systems Product Portfolio
8.7.3. Eos GmbH Electro Optical Systems Financial Overview
8.7.4. Eos GmbH Electro Optical Systems News/Recent Developments
8.8. Materialise NV.
8.8.1. Materialise NV. Overview
8.8.2. Materialise NV. Product Portfolio
8.8.3. Materialise NV. Financial Overview
8.8.4. Materialise NV. News/Recent Developments
8.9. Sandvik AB
8.9.1. Sandvik AB Overview
8.9.2. Sandvik AB Product Portfolio
8.9.3. Sandvik AB Financial Overview
8.9.4. Sandvik AB News/Recent Developments
8.10. Evonik Industries AG
8.10.1. Evonik Industries AG Overview
8.10.2. Evonik Industries AG Product Portfolio
8.10.3. Evonik Industries AG Financial Overview
8.10.4. Evonik Industries AG News/Recent Developments
Chapter 9 Preface
9.1. Data Triangulation
9.2. Research Methodology
9.2.1. Phase I – Secondary Research
9.2.2. Phase II – Primary Research
9.2.3. Phase III – Expert Panel Review
9.2.4. Approach Adopted
9.2.4.1. Top-Down Approach
9.2.4.2. Bottom-Up Approach
9.2.5. Supply- Demand side
9.2.6. Breakup of the Primary Profiles


 Log in / Register


