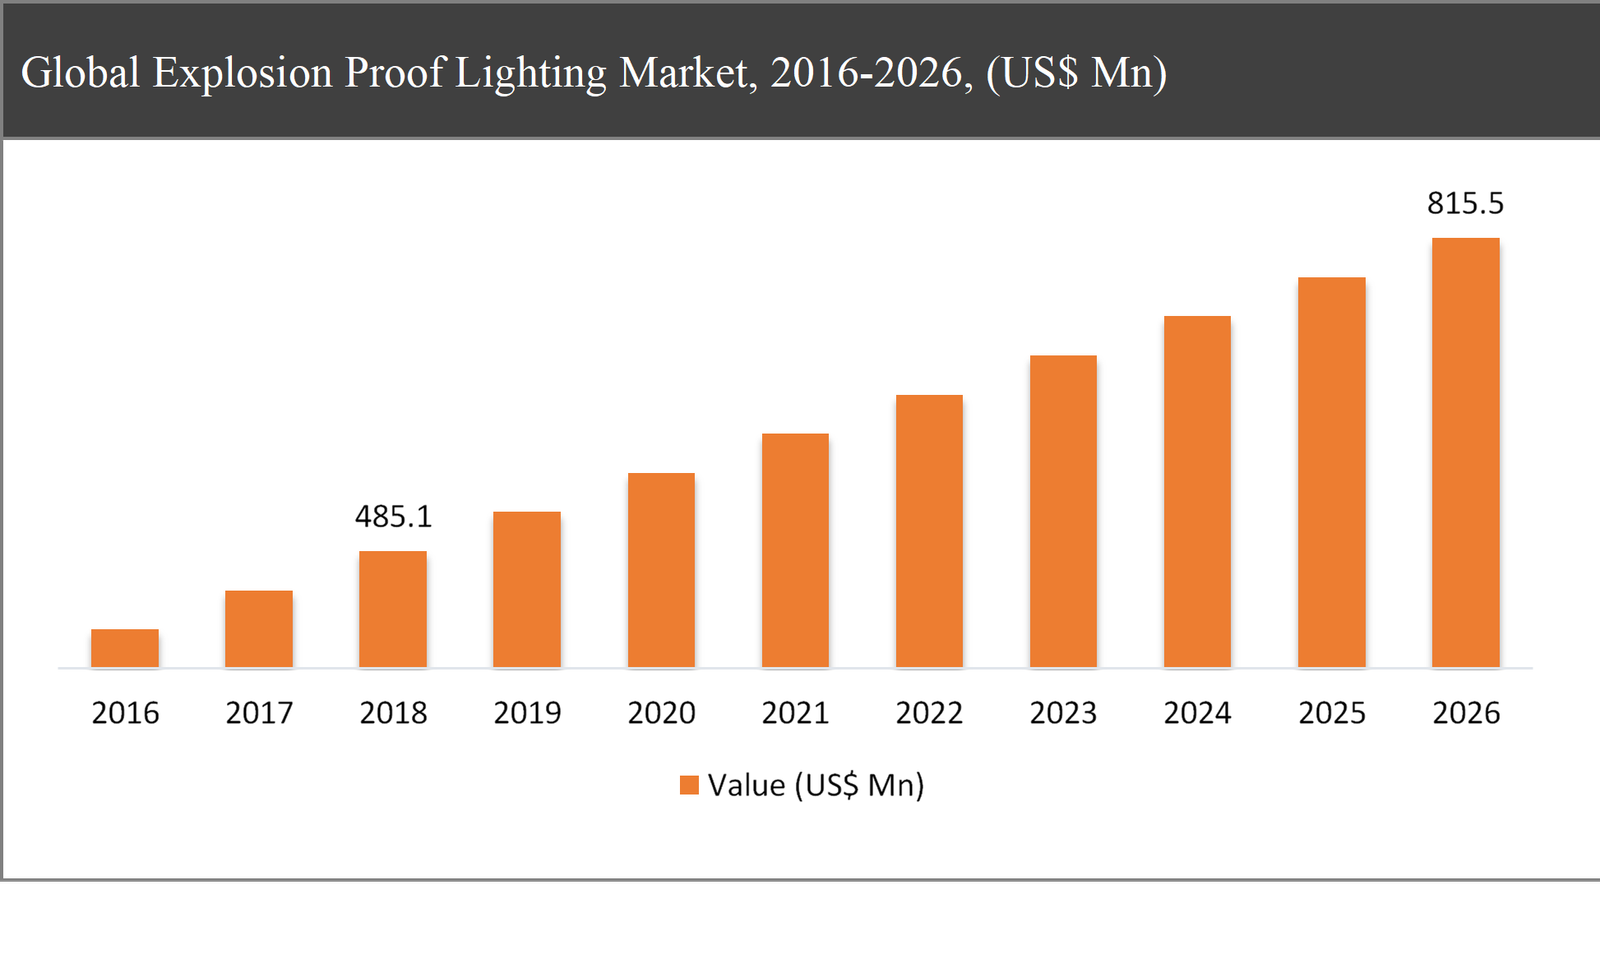
The Global Explosion Proof Lighting Market was valued at USD 485.1 million in 2018 and is expected to reach USD 815.5 Million in 2026, growing at a CAGR of 6.7% during the forecast period.
Explosion Proof Lighting is commonly known as intrinsically safe lights and hazards location lights. The Explosion Proof Lighting is designed to offer extensive illumination and able to isolate sparks within the unit to prevent explosions from escaping in the hazardous workplace and reduces the risk of explosive reaction from spreading, or igniting volatile substances in the area, during an explosion. The light source provided by this explosion proof lighting is LED lighting, high-intensity discharge (HID) lighting, and fluorescent lighting.
Explosion Proof Lighting Market Segmentation |
|
| By Type | 1. Fixed Lighting |
| 2. Mobile Lighting | |
| 3. Small & Portable Lighting | |
| By Light Type | 1. Incandescent |
| 2. Florescent | |
| 3. LED | |
| 4. HID | |
| By Application | 1. Chemical |
| 2. Marine | |
| 3. Power Plants | |
| 4. Airports | |
| 5. Military Bases | |
| 6. Oil & Gas | |
| 7. Laboratory | |
| 8. Food & Beverage | |
| 9. Transportation Facility | |
| 10. Others | |
| By Region | 1. North America (US and Canada) |
| 2. Europe (UK, Germany, France and Rest of Europe) | |
| 3. Asia Pacific (China, Japan, India and Rest of Asia Pacific) | |
| 4. Latin America (Brazil, Mexico and Rest of Latin America) | |
| 5. Middle East & Africa (GCC and Rest of Middle East & Africa) | |
The growth of the Explosion Proof Lighting Market is primarily driven by stringent regulation pertaining to worker safety in remote and hazardous areas, enhancing safety and productivity in harsh and hazardous areas, and a growing number of offshore oil and gas stations. Moreover, rising demand from growing end-use industries, such as chemicals, oil & gas, marine, mining, food & beverages, industrial, military bases, airports and other sectors in emerging countries also drives the growth of the global explosion proof lighting market. On the other hand, volatility in raw material cost, high cost of implementation and equipment, and lack of industry standardization are creating a major hindrance for its market growth. However, continuous development in wireless explosion proof lighting and integration of LEDs in wireless data transfer is expected to create major growth opportunities during the forecast period.
The mobile lighting segment expected to grow at the fastest rate of 8.5% CAGR during the forecast period
Based on the type, the global explosion proof lighting market has been segmented into fixed lighting, Mobile Lighting, and Small & Portable Lighting. Due to its excellent properties like high durability and extensive illumination, mobile lighting is the most widely used Explosion Proof Lighting across the end-use industries, globally. Moreover, mobile lighting is largely used due to performance efficiency, while reducing the risk of injuries and minimizing the occurrence of failures. Due to these factors, mobile lighting is expected to grow at the fastest rate throughout the forecast period.
Based on the light type, the LED segment is expected to lead during the forecast period
Based on the light type, the market has been segmented into Incandescent, Fluorescent, LED, and HID. The LED segment accounted for the largest share in the market in 2018. Owing to its low maintenance costs, energy-efficient, and low cost of the systems in comparison with its conventional counterparts is an ideal solution for harsh and hazardous applications. Again, major manufacturers of Explosion Proof Lighting developing the wireless control platforms for LEDs further expected to increase the demand for LED expulsion proof lights during the forecast period.
Based on the application, the oil & gas segment is expected to lead during the forecast period
Based on the application, the market has been segmented into chemical, marine, power plants, airports, military bases, oil & gas, laboratory, food & beverage, transportation facility, and others. The oil & gas segment accounted for the largest share in the market in 2018. Oil and gas have strict requirement, which includes very high illuminance levels and contrast and color rendition. Moreover, the requirement of Explosion Proof Lighting in processing facilities, drilling rigs, offshore platforms and petroleum refineries in the oil and gas industry expected to increase the demand for expulsion proof lights during the forecast period.
Asia-Pacific to dominate the Explosion Proof Lighting market throughout the forecast period
In 2018, Asia-Pacific holds nearly 40% market share in the market. This expected enhance its dominance in the market throughout the forecast period followed by the North America and Europe. Additionally, the strong economic growth in Asia-Pacific is one of the key factors driving the consumption of Explosion Proof Lighting. Moreover, the growth of construction, automotive, textile manufacturing, metal production and processing, petroleum, coal, chemicals, cement, pharmaceuticals, the aerospace industry in key countries such as Japan, India, and China are also propelling the growth of Explosion Proof Lighting in the Asia-Pacific region. While, Europe accounted for the highest CAGR in the global explosion proof lighting market during the forecast period owing to increase investment from the government and related authorities.
Company Profiles and Competitive Intelligence:
The major players operating in the global explosion proof lighting market are ABB (Switzerland), Eaton Corporation Plc (Ireland), General Electric (US), Hubbell Inc. (US), Osram Licht AG (Germany), Emerson (US), Philips Lighting Holding B.V. (Netherlands), Abtech Ltd (UK), and Adolf Schuch GmbH (Germany), Larson Electronics (US), among others.

Ask for free product review call with the author

Share your specific research requirements for a customized report

Request for due diligence and consumer centric studies

Request for study updates, segment specific and country level reports
Table of Contents
Chapter 1 Executive Summary
1.1. Market Summary
1.1.1. Global Explosion Proof Lighting Market, 2016-2026, (USD Million)
1.2. Market Snapshot: Global Explosion Proof Lighting Market
1.3. Market Dynamics
1.4. Global Explosion Proof Lighting Market, by Segment, 2018
1.4.1. Global Explosion Proof Lighting Market, by Type, 2018, (USD Million)
1.4.2. Global Explosion Proof Lighting Market, by Light Type, 2018, (USD Million)
1.4.3. Global Explosion Proof Lighting Market, by Application, 2018, (USD Million)
1.4.4. Global Explosion Proof Lighting Market, by Region, 2018 (USD Million)
1.5. Premium Insights
1.5.1. Explosion Proof Lighting Market In Developed Vs. Developing Economies, 2018 vs 2026
1.5.2. Global Explosion Proof Lighting Market: Regional Life Cycle Analysis
Chapter 2 Market Dynamics
2.1. Market Overview
2.2. Market Drivers
2.2.1. Stringent regulation pertaining to worker safety in remote and hazardous areas
2.2.2. Enhancing safety and productivity in harsh and hazardous areas
2.2.3. Growing demand from end user industries
2.3. Market Restraints
2.3.1. High cost of implementation and equipment
2.3.2. Lack of industry standardization
2.4. Market Opportunities
2.4.1. Continuous development in wireless explosion proof lighting
2.4.2. Integration of LEDs in wireless data transfer
2.5. Industry Value Chain Analysis
2.6. Pricing Analysis
2.7. Porter’s Five Forces Analysis
Chapter 3 Global Explosion Proof Lighting Market, by Type
3.1. Market Overview, by Type
3.1.1. Global Explosion Proof Lighting Market, by Type, 2016-2026 (USD Million)
3.1.2. Incremental Opportunity, by Type, 2018
3.2. Fixed Lighting
3.2.1. Global Explosion Proof Lighting Market, by Fixed Lighting, 2016-2026, (USD Million)
3.3. Mobile Lighting
3.3.1. Global Explosion Proof Lighting Market, by Mobile Lighting, 2016-2026, (USD Million)
3.4. Small & Portable Lighting
3.4.1. Global Explosion Proof Lighting Market, by Small & Portable Lighting, 2016-2026, (USD Million)
Chapter 4 Global Explosion Proof Lighting Market, by Light Type
4.1. Market Overview, by Light Type
4.1.1. Global Explosion Proof Lighting Market, by Light Type, 2016-2026 (USD Million)
4.1.2. Incremental Opportunity, by Light Type, 2018
4.2. Incandescent
4.2.1. Global Explosion Proof Lighting Market, by Incandescent, 2016-2026, (USD Million)
4.3. Fluorescent
4.3.1. Global Explosion Proof Lighting Market, by Fluorescent, 2016-2026, (USD Million)
4.4. LED
4.4.1. Global Explosion Proof Lighting Market, by LED, 2016-2026, (USD Million)
4.5. HID
4.5.1. Global Explosion Proof Lighting Market, by HID, 2016-2026, (USD Million)
Chapter 5 Global Explosion Proof Lighting Market, by Application
5.1. Market Overview, by Application
5.1.1. Global Explosion Proof Lighting Market, by Application, 2016-2026 (USD Million)
5.1.2. Incremental Opportunity, by Application, 2018
5.2. Chemical
5.2.1. Global Explosion Proof Lighting Market, by Chemical, 2016-2026, (USD Million)
5.3. Marine
5.3.1. Global Explosion Proof Lighting Market, by Marine, 2016-2026, (USD Million)
5.4. Power Plants
5.4.1. Global Explosion Proof Lighting Market, by Power Plants, 2016-2026, (USD Million)
5.5. Airports
5.5.1. Global Explosion Proof Lighting Market, by Airports, 2016-2026, (USD Million)
5.6. Military Bases
5.6.1. Global Explosion Proof Lighting Market, by Military Bases, 2016-2026, (USD Million)
5.7. Oil & Gas
5.7.1. Global Explosion Proof Lighting Market, by Oil & Gas, 2016-2026, (USD Million)
5.8. Laboratory
5.8.1. Global Explosion Proof Lighting Market, by Laboratory, 2016-2026, (USD Million)
5.9. Food & Beverage
5.9.1. Global Explosion Proof Lighting Market, by Food & Beverage, 2016-2026, (USD Million)
5.10. Transportation Facility
5.10.1. Global Explosion Proof Lighting Market, by Transportation Facility, 2016-2026, (USD Million)
5.11. Others
5.11.1. Global Explosion Proof Lighting Market, by Others, 2016-2026, (USD Million)
Chapter 6 Global Explosion Proof Lighting Market, by Region
6.1. Market Overview, by Region
6.1.1. Global Explosion Proof Lighting Market, by Region, 2016-2026, (USD Million)
6.2. Attractive Investment Opportunity, by Region, 2018
6.3. North America Explosion Proof Lighting Market
6.3.1. North America Explosion Proof Lighting Market, by Type, 2016-2026 (USD Million)
6.3.2. North America Explosion Proof Lighting Market, by Light Type, 2016-2026 (USD Million)
6.3.3. North America Explosion Proof Lighting Market, by Application, 2016-2026 (USD Million)
6.3.4. United States Explosion Proof Lighting Market, 2016-2026 (USD Million)
6.3.5. Canada Explosion Proof Lighting Market, 2016-2026 (USD Million)
6.4. Europe Explosion Proof Lighting Market
6.4.1. Europe Explosion Proof Lighting Market, by Type, 2016-2026 (USD Million)
6.4.2. Europe Explosion Proof Lighting Market, by Light Type, 2016-2026 (USD Million)
6.4.3. Europe Explosion Proof Lighting Market, by Application, 2016-2026 (USD Million)
6.4.4. United Kingdom Explosion Proof Lighting Market, 2016-2026 (USD Million)
6.4.5. Germany Explosion Proof Lighting Market, 2016-2026 (USD Million)
6.4.6. France Explosion Proof Lighting Market, 2016-2026 (USD Million)
6.4.7. Rest of Europe Explosion Proof Lighting Market, 2016-2026 (USD Million)
6.5. Asia Pacific Explosion Proof Lighting Market
6.5.1. Asia Pacific Explosion Proof Lighting Market, by Type, 2016-2026 (USD Million)
6.5.2. Asia Pacific Explosion Proof Lighting Market, by Light Type, 2016-2026 (USD Million)
6.5.3. Asia Pacific Explosion Proof Lighting Market, by Application, 2016-2026 (USD Million)
6.5.4. China Explosion Proof Lighting Market, 2016-2026 (USD Million)
6.5.5. Japan Explosion Proof Lighting Market, 2016-2026 (USD Million)
6.5.6. India Explosion Proof Lighting Market, 2016-2026 (USD Million)
6.5.7. Rest of Asia Pacific Explosion Proof Lighting Market, 2016-2026 (USD Million)
6.6. Latin America Explosion Proof Lighting Market
6.6.1. Latin America Explosion Proof Lighting Market, by Type, 2016-2026 (USD Million)
6.6.2. Latin America Explosion Proof Lighting Market, by Light Type, 2016-2026 (USD Million)
6.6.3. Latin America Explosion Proof Lighting Market, by Application, 2016-2026 (USD Million)
6.6.4. Brazil Explosion Proof Lighting Market, 2016-2026 (USD Million)
6.6.5. Mexico Explosion Proof Lighting Market, 2016-2026 (USD Million)
6.6.6. Rest of Latin America Explosion Proof Lighting Market, 2016-2026 (USD Million)
6.7. Middle East & Africa Explosion Proof Lighting Market
6.7.1. Middle East & Africa Explosion Proof Lighting Market, by Type, 2016-2026 (USD Million)
6.7.2. Middle East & Africa Explosion Proof Lighting Market, by Light Type, 2016-2026 (USD Million)
6.7.3. Middle East & Africa Explosion Proof Lighting Market, by Application, 2016-2026 (USD Million)
6.7.4. GCC Explosion Proof Lighting Market, 2016-2026 (USD Million)
6.7.5. Rest of Middle East & Africa Explosion Proof Lighting Market, 2016-2026 (USD Million)
Chapter 7 Competitive Intelligence
7.1. Top 5 Players Comparison
7.2. Market Positioning of Key Players, 2018
7.3. Market Players Mapping
7.3.1. By Type
7.3.2. By Light Type
7.3.3. By Application
7.3.4. By Region
7.4. Strategies Adopted by Key Market Players
7.5. Recent Developments in the Market
7.5.1. Mergers & Acquisitions, Partnership, New Product Developments
Chapter 8 Company Profiles
8.1. ABB
8.1.1. ABB Overview
8.1.2. ABB Products Portfolio
8.1.3. ABB Financial Overview
8.1.4. ABB News/Recent Developments
8.2. Eaton Corporation Plc
8.2.1. Eaton Corporation Plc Overview
8.2.2. Eaton Corporation Plc Products Portfolio
8.2.3. Eaton Corporation Plc Financial Overview
8.2.4. Eaton Corporation Plc News/Recent Developments
8.3. General Electric
8.3.1. General Electric Overview
8.3.2. General Electric Products Portfolio
8.3.3. General Electric Financial Overview
8.3.4. General Electric News/Recent Developments
8.4. Hubbell Inc.
8.4.1. Hubbell Inc. Overview
8.4.2. Hubbell Inc. Products Portfolio
8.4.3. Hubbell Inc. Financial Overview
8.4.4. Hubbell Inc. News/Recent Developments
8.5. Osram Licht AG
8.5.1. Osram Licht AG Overview
8.5.2. Osram Licht AG Products Portfolio
8.5.3. Osram Licht AG Financial Overview
8.5.4. Osram Licht AG News/Recent Developments
8.6. Emerson
8.6.1. Emerson Overview
8.6.2. Emerson Products Portfolio
8.6.3. Emerson Financial Overview
8.6.4. Emerson News/Recent Developments
8.7. Philips Lighting Holding B.V.
8.7.1. Philips Lighting Holding B.V. Overview
8.7.2. Philips Lighting Holding B.V. Products Portfolio
8.7.3. Philips Lighting Holding B.V. Financial Overview
8.7.4. Philips Lighting Holding B.V. News/Recent Developments
8.8. Abtech Ltd
8.8.1. Abtech Ltd Overview
8.8.2. Abtech Ltd Products Portfolio
8.8.3. Abtech Ltd Financial Overview
8.8.4. Abtech Ltd News/Recent Developments
8.9. Adolf Schuch GmbH
8.9.1. Adolf Schuch GmbH Overview
8.9.2. Adolf Schuch GmbH Products Portfolio
8.9.3. Adolf Schuch GmbH Financial Overview
8.9.4. Adolf Schuch GmbH News/Recent Developments
8.10. Larson Electronics
8.10.1. Larson Electronics Overview
8.10.2. Larson Electronics Products Portfolio
8.10.3. Larson Electronics Financial Overview
8.10.4. Larson Electronics News/Recent Developments
Chapter 9 Preface
9.1. Data Triangulation
9.2. Research Methodology
9.2.1. Light Type I – Secondary Research
9.2.2. Light Type II – Primary Research
9.2.3. Light Type III – Expert Panel Review
9.2.4. Approach Adopted
9.2.4.1. Top-Down Approach
9.2.4.2. Bottom-Up Approach
9.2.5. Supply- Demand side
9.2.6. Breakup of the Primary Profiles


 Log in / Register


