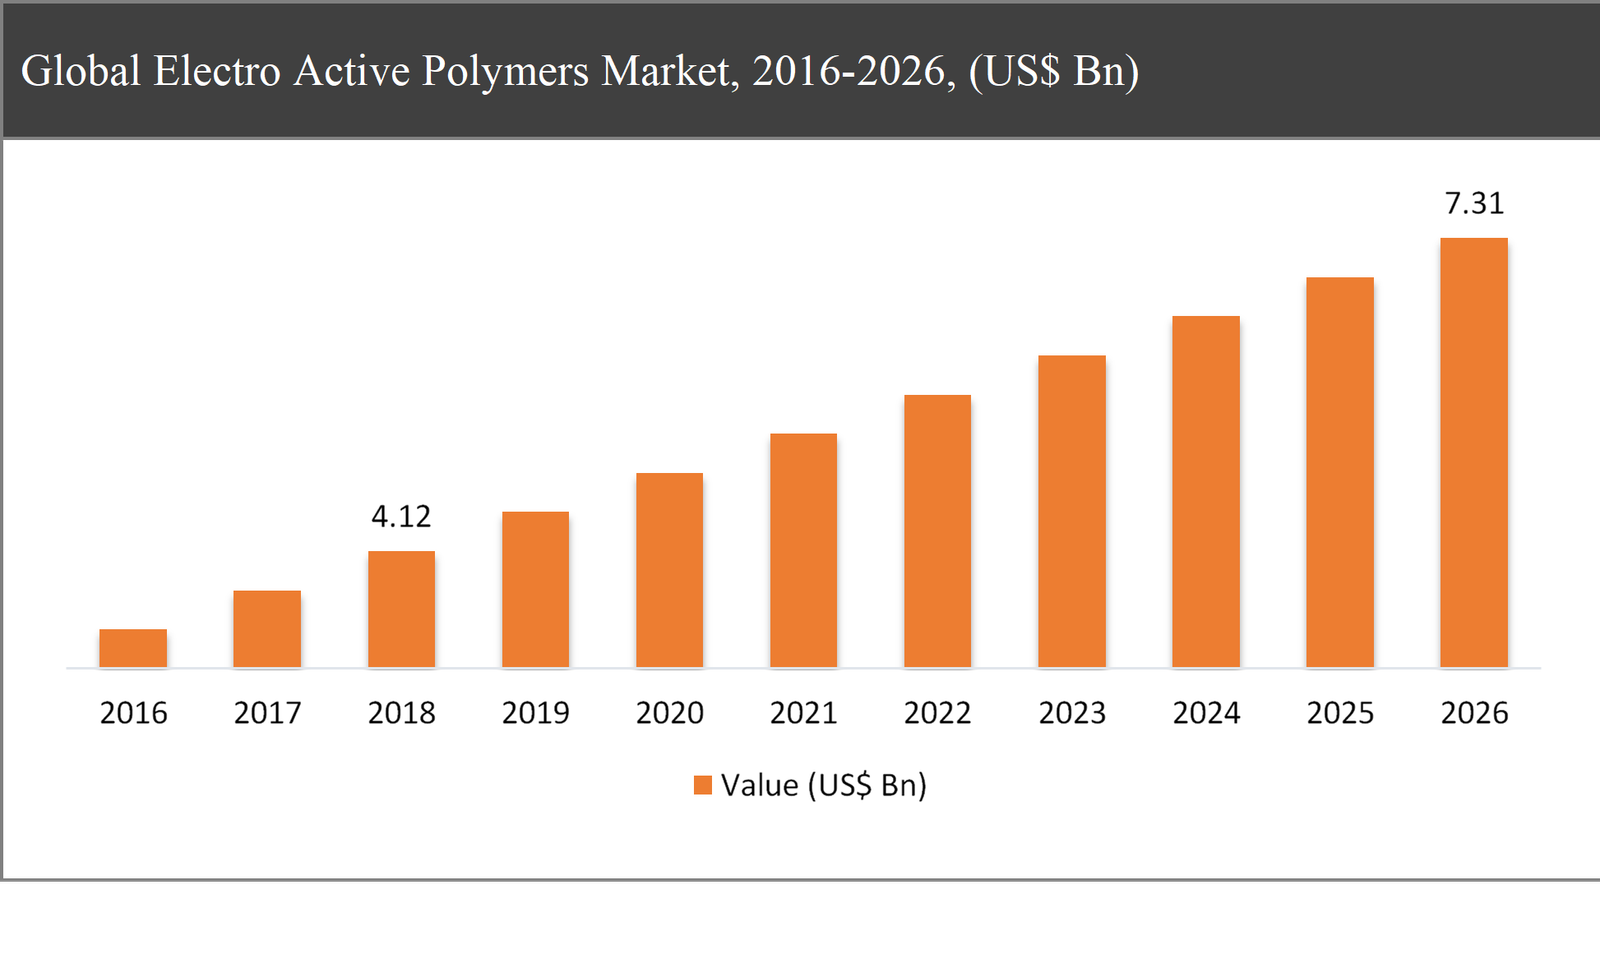
The global electro active polymers market was valued at USD 4.12 billion in 2018 and is expected to reach USD 7.31 billion in 2026, growing at a CAGR of 7.6% during the forecast period.
Electro active polymers are a field of material that demonstrates large strain in response to electrical fields. These actuators closely emulate the stimulus-response capacities of animal muscle and so are often referred to as artificial muscles. A non-exhaustive list of potential EAP material applications includes biomimetic such as artificial muscles, active catheters, and biomimetic robots, tactile displays such as refreshable braille devices, and unmanned vehicles including aerial, underwater, and aerospace devices.
|
By Type |
|
|
By Application |
|
|
By Region |
|
Rising demand for electro active polymers in the electronics industry coupled with the increasing significance of piezoelectric devices are some of the major factors driving the growth of the electro active polymers market. However, the fluctuations in prices and the impact of these polymers on the environment could possibly restrain market growth.
The inherently conductive polymers segment is expected to grow at the fastest rate, a CAGR of 8.7%, during the forecast period
Based on type, the electro active polymers market has been segmented into inherently conductive polymers, conductive plastics, inherently dissipative polymers, and others. Among these types of electro active polymers, the inherently conductive polymers segment is projected to exhibit the fastest growth in the global market during the forecast period. This growth can be attributed to its several advantageous factors, such as solubility along with its ability of modifying the shape by motion or by diffusion of ions.
Based on application, the actuators segment contributes a major share in the global electro active polymers market
Based on applications, the market has been segmented into actuators, sensors, EMI & ESD shielding, antistatic packaging, and others. In 2018, the actuators segment accounted to register a remarkable share of 31% in the market. This is mainly owing to the increasing application of electro active polymers in actuators, as it possesses operational efficiency over conventional materials. The major advantage actuators is its reliability and they are maintenance-free; therefore, it can be operated billions of times without incurring wear or deterioration.
Asia Pacific to exhibit the fastest growth in the global electro active polymers market throughout the forecast period
Asia Pacific is projected to witness the fastest growth rate, at a CAGR of 9.2%, in the global electro active polymers market during the forecast period. This growth is mainly attributed to the presence of largest electronic sector in China and Japan. Moreover, the favourable government regulations and the presence of significant number of electro active polymers, is another factor that significantly drives the growth of the market in Asia Pacific.
Company Profiles and Competitive Intelligence in Electro Active Polymers Market Report are:
The major players operating in the global electro active polymers market are Solvay S.A. (Belgium), Parker Hannifin Corp. (US), 3M Company (US), Merck KGaA (Germany), The Lubrizol Corporation (US), Novasentis Inc. (US), Premix Group (Finland), PolyOne Corporation (US), Arkema Group (France), and CEDRAT TECHNOLOGIES SA (France), among others.

Ask for free product review call with the author

Share your specific research requirements for a customized report

Request for due diligence and consumer centric studies

Request for study updates, segment specific and country level reports
Chapter 1 Executive Summary
1.1. Market Summary
1.1.1. Global Electro Active Polymers Market, 2016-2026, (USD Million)
1.2. Market Snapshot: Global Electro Active Polymers Market
1.3. Market Dynamics
1.4. Global Electro Active Polymers Market, by Segment, 2018
1.4.1. Global Electro Active Polymers Market, by Type, 2018, (USD Million)
1.4.2. Global Electro Active Polymers Market, by Application, 2018, (USD Million)
1.4.3. Global Electro Active Polymers Market, by Region, 2018 (USD Million)
1.5. Premium Insights
1.5.1. Electro Active Polymers Market In Developed Vs. Developing Economies, 2018 vs 2026
1.5.2. Global Electro Active Polymers Market: Regional Life Cycle Analysis
Chapter 2 Market Dynamics
2.1. Market Overview
2.2. Market Drivers
2.2.1. Rising demand for electro active polymers in electronics industry
2.2.2. Increasing significance of piezoelectric devices
2.3. Market Restraints
2.3.1. Fluctuations in raw material prices
2.4. Market Opportunities
2.4.1. Increasing Biomimetic Applications
2.5. Industry Value Chain Analysis
2.6. Pricing Analysis
2.7. Porter’s Five Forces Analysis
Chapter 3 Global Electro Active Polymers Market, by Type
3.1. Market Overview, by Type
3.1.1. Global Electro Active Polymers Market, by Type, 2016-2026 (USD Million)
3.1.2. Incremental Opportunity, by Type, 2018
3.2. Inherently Conductive Polymers
3.2.1. Global Electro Active Polymers Market, by Inherently Conductive Polymers, 2016-2026, (USD Million)
3.3. Conductive Plastics
3.3.1. Global Electro Active Polymers Market, by Conductive Plastics, 2016-2026, (USD Million)
3.4. Inherently Dissipative Polymers
3.4.1. Global Electro Active Polymers Market, by Inherently Dissipative Polymers, 2016-2026, (USD Million)
3.5. Others
3.5.1. Global Electro Active Polymers Market, by Others, 2016-2026, (USD Million)
Chapter 4 Global Electro Active Polymers Market, by Application
4.1. Market Overview, by Application
4.1.1. Global Electro Active Polymers Market, by Application, 2016-2026 (USD Million)
4.1.2. Incremental Opportunity, by Application, 2018
4.2. Actuators
4.2.1. Global Electro Active Polymers Market, by Actuators, 2016-2026, (USD Million)
4.3. Sensors
4.3.1. Global Electro Active Polymers Market, by Sensors, 2016-2026, (USD Million)
4.4. EMI & ESD Shielding
4.4.1. Global Electro Active Polymers Market, by EMI & ESD Shielding, 2016-2026, (USD Million)
4.5. Antistatic Packaging
4.5.1. Global Electro Active Polymers Market, by Antistatic Packaging, 2016-2026, (USD Million)
4.6. Others
4.6.1. Global Electro Active Polymers Market, by Others, 2016-2026, (USD Million)
Chapter 5 Global Electro Active Polymers Market, by Region
5.1. Market Overview, by Region
5.1.1. Global Electro Active Polymers Market, by Region, 2016-2026, (USD Million)
5.2. Attractive Investment Opportunity, by Region, 2018
5.3. North America Electro Active Polymers Market
5.3.1. North America Electro Active Polymers Market, by Type, 2016-2026 (USD Million)
5.3.2. North America Electro Active Polymers Market, by Application, 2016-2026 (USD Million)
5.3.3. United States Electro Active Polymers Market, 2016-2026 (USD Million)
5.3.4. Canada Electro Active Polymers Market, 2016-2026 (USD Million)
5.4. Europe Electro Active Polymers Market
5.4.1. Europe Electro Active Polymers Market, by Type, 2016-2026 (USD Million)
5.4.2. Europe Electro Active Polymers Market, by Application, 2016-2026 (USD Million)
5.4.3. United Kingdom Electro Active Polymers Market, 2016-2026 (USD Million)
5.4.4. Germany Electro Active Polymers Market, 2016-2026 (USD Million)
5.4.5. France Electro Active Polymers Market, 2016-2026 (USD Million)
5.4.6. Rest of Europe Electro Active Polymers Market, 2016-2026 (USD Million)
5.5. Asia Pacific Electro Active Polymers Market
5.5.1. Asia Pacific Electro Active Polymers Market, by Type, 2016-2026 (USD Million)
5.5.2. Asia Pacific Electro Active Polymers Market, by Application, 2016-2026 (USD Million)
5.5.3. China Electro Active Polymers Market, 2016-2026 (USD Million)
5.5.4. Japan Electro Active Polymers Market, 2016-2026 (USD Million)
5.5.5. India Electro Active Polymers Market, 2016-2026 (USD Million)
5.5.6. Rest of Asia Pacific Electro Active Polymers Market, 2016-2026 (USD Million)
5.6. Latin America Electro Active Polymers Market
5.6.1. Latin America Electro Active Polymers Market, by Type, 2016-2026 (USD Million)
5.6.2. Latin America Electro Active Polymers Market, by Application, 2016-2026 (USD Million)
5.6.3. Brazil Electro Active Polymers Market, 2016-2026 (USD Million)
5.6.4. Mexico Electro Active Polymers Market, 2016-2026 (USD Million)
5.6.5. Rest of Latin America Electro Active Polymers Market, 2016-2026 (USD Million)
5.7. Middle East & Africa Electro Active Polymers Market
5.7.1. Middle East & Africa Electro Active Polymers Market, by Type, 2016-2026 (USD Million)
5.7.2. Middle East & Africa Electro Active Polymers Market, by Application, 2016-2026 (USD Million)
5.7.3. GCC Electro Active Polymers Market, 2016-2026 (USD Million)
5.7.4. Rest of Middle East & Africa Electro Active Polymers Market, 2016-2026 (USD Million)
Chapter 6 Competitive Intelligence
6.1. Top 5 Players Comparison
6.2. Market Positioning of Key Players, 2018
6.3. Market Players Mapping
6.3.1. By Type
6.3.2. By Application
6.3.3. By Region
6.4. Strategies Adopted by Key Market Players
6.5. Recent Developments in the Market
6.5.1. Mergers & Acquisitions, Partnership, New Type Developments
Chapter 7 Company Profiles
7.1. Solvay S.A.
7.1.1. Solvay S.A. Overview
7.1.2. Solvay S.A. Types Portfolio
7.1.3. Solvay S.A. Financial Overview
7.1.4. Solvay S.A. News/Recent Developments
7.2. Parker Hannifin Corp.
7.2.1. Parker Hannifin Corp. Overview
7.2.2. Parker Hannifin Corp. Types Portfolio
7.2.3. Parker Hannifin Corp. Financial Overview
7.2.4. Parker Hannifin Corp. News/Recent Developments
7.3. 3M Company
7.3.1. 3M Company Overview
7.3.2. 3M Company Types Portfolio
7.3.3. 3M Company Financial Overview
7.3.4. 3M Company News/Recent Developments
7.4. Merck KGaA
7.4.1. Merck KGaA Overview
7.4.2. Merck KGaA Types Portfolio
7.4.3. Merck KGaA Financial Overview
7.4.4. Merck KGaA News/Recent Developments
7.5. The Lubrizol Corporation
7.5.1. The Lubrizol Corporation Overview
7.5.2. The Lubrizol Corporation Types Portfolio
7.5.3. The Lubrizol Corporation Financial Overview
7.5.4. The Lubrizol Corporation News/Recent Developments
7.6. Novasentis Inc.
7.6.1. Novasentis Inc. Overview
7.6.2. Novasentis Inc. Types Portfolio
7.6.3. Novasentis Inc. Financial Overview
7.6.4. Novasentis Inc. News/Recent Developments
7.7. Premix Group
7.7.1. Premix Group Overview
7.7.2. Premix Group Types Portfolio
7.7.3. Premix Group Financial Overview
7.7.4. Premix Group News/Recent Developments
7.8. PolyOne Corporation
7.8.1. PolyOne Corporation Overview
7.8.2. PolyOne Corporation Types Portfolio
7.8.3. PolyOne Corporation Financial Overview
7.8.4. PolyOne Corporation News/Recent Developments
7.9. Arkema Group
7.9.1. Arkema Group Overview
7.9.2. Arkema Group Types Portfolio
7.9.3. Arkema Group Financial Overview
7.9.4. Arkema Group News/Recent Developments
7.10. CEDRAT TECHNOLOGIES SA
7.10.1. CEDRAT TECHNOLOGIES SA Overview
7.10.2. CEDRAT TECHNOLOGIES SA Types Portfolio
7.10.3. CEDRAT TECHNOLOGIES SA Financial Overview
7.10.4. CEDRAT TECHNOLOGIES SA News/Recent Developments
Chapter 8 Preface
8.1. Data Triangulation
8.2. Research Methodology
8.2.1. Phase I – Secondary Research
8.2.2. Phase II – Primary Research
8.2.3. Phase III – Expert Panel Review
8.2.4. Approach Adopted
8.2.4.1. Top-Down Approach
8.2.4.2. Bottom-Up Approach
8.2.5. Supply- Demand side
8.2.6. Breakup of the Primary Profiles


 Log in / Register


