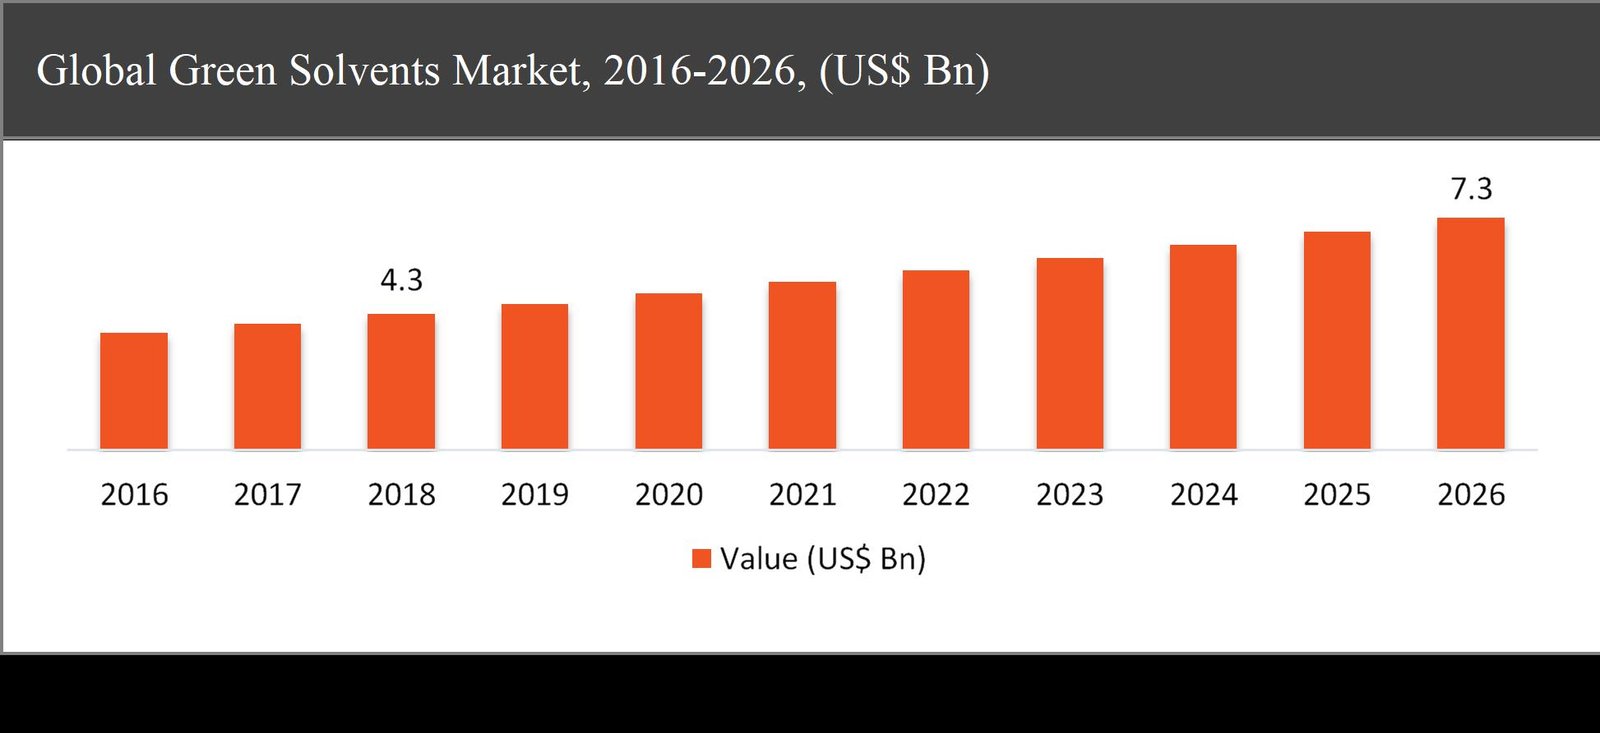
The global green solvents market was valued at USD 4.3 billion in 2018 and is expected to reach USD 7.3 billion in 2026, growing at a CAGR of 6.6% during the forecast period.
Green solvents are organic solvents or bio-solvents produced from agricultural processing. They have been developed as a friendly solvent alternating with petrochemical solvents in the environment. Solvents are classified into two types, which are water-based and hydrocarbon-based. They are consists of characteristics, which are used to develop green and efficient chemical processes. Due to their environmental friendliness, they are becoming increasingly important. Green solvents are mostly used in analytical chemistry, synthetic chemistry, and crystallization in the chemical industry.
The growth of the green solvents market is primarily driven by the rising demand for green solvents in end-use industries. Moreover, rising awareness regarding environmental protection, developing economies, and volatile prices of crude oils also drive the growth of the global green solvents market. On the other hand, the requirement of huge investment costs for production is creating a major hindrance to its market growth. However, support from the federal government and the implementations of the regulatory framework in developing economies are expected to create major growth opportunities during the forecast period.
Green Solvents Market Segmentation |
|
| By Type | 1. Esters |
| 2. Alcohols | |
| 3. Diols & Glycols | |
| 4. D-Limonene | |
| 5. Others | |
| By Application | 1. Paints & Coatings |
| 2. Adhesives & Sealants | |
| 3. Printing Ink | |
| 4. Industrial & Domestic Cleaners | |
| By Region | 1. North America (US and Canada) |
| 2. Europe (UK, Germany, France and Rest of Europe) | |
| 3. Asia Pacific (China, Japan, India and Rest of Asia Pacific) | |
| 4. Latin America (Brazil, Mexico and Rest of Latin America) | |
| 5. Middle East & Africa (GCC and Rest of Middle East & Africa) | |
The esters segment expected to grow at a CAGR of 8.3% during the forecast period
Based on type, the global green solvents market has been segmented into esters, alcohols, diols & glycols, d-limonene, and others. The esters segment expected to grow at the highest CAGR of 8.3% during the forecast period. Due to its large application range, comparatively small prices than other green solvents and easy accessibility, the use of esters in the overall market for green solvents is higher during the forecast period.
Based on application, the paints & coating segment is expected to lead during the forecast period
Based on application, the green solvents market has been segmented into paints & coatings, adhesives & sealants, printing ink, and industrial & domestic cleaners. The paints & coating segment accounted for almost 40% of market share in 2018. The adoption of green solvents in the paint and coating industry leads to increasing environmental concerns in combination with growing consumer awareness of eco-friendly products. The paints & coating segment accounted for the largest share in the market in 2018. Owing to its low VOC content, the green solvent is an ideal solution for paints & coatings applications. Again, green solvents are not flammable that reduces its storage & handling charges and fire insurance costs. Moreover, the manufacturing process of green solvents paints & coatings requires a lower carbon footprint as they consume less energy.
Asia-Pacific to dominate the green solvents market throughout the forecast period
Asia-Pacific accounted for nearly 31% share of the global green solvents market in 2018 and is expected to dominate the market throughout the forecast period followed by North America. During the forecast period, increased awareness of environmental protection is expected to promote regional growth. Strong economic growth in the Asia-Pacific region is one of the key factors driving the consumption of green solvents in this region. Moreover, the growth of the construction, automotive, and textile manufacturing industries in key countries such as Japan, India, and China are also propelling the growth of green solvents in the Asia-Pacific region.
Company Profiles and Competitive Intelligence Covered in Green Solvents Market Report are:
The major players operating in the global green solvents market are BASF SE (Germany), BioAmber Inc. (US), Myriant Corporation (US), Dow Chemicals (US), Cargill Incorporated(US),Gevo Inc.(US), Vertec Bio solvents Inc. (US), Florida Chemicals (US), Lyondellbasell (Netherlands), and Solvay S.A (Belgium) among others.

Ask for free product review call with the author

Share your specific research requirements for a customized report

Request for due diligence and consumer centric studies

Request for study updates, segment specific and country level reports
Chapter 1 Executive Summary
1.1. Market Summary
1.1.1. Global Green Solvents Market, 2016-2026, (USD Million)
1.2. Market Snapshot: Global Green Solvents Market
1.3. Market Dynamics
1.4. Global Green Solvents Market, by Segment, 2018
1.4.1. Global Green Solvents Market, by Type, 2018, (USD Million)
1.4.2. Global Green Solvents Market, by Application, 2018, (USD Million)
1.4.3. Global Green Solvents Market, by Region, 2018 (USD Million)
1.5. Premium Insights
1.5.1. Green Solvents Market In Developed Vs. Developing Economies, 2018 vs 2026
1.5.2. Global Green Solvents Market: Regional Life Cycle Analysis
Chapter 2 Market Dynamics
2.1. Market Overview
2.2. Market Drivers
2.2.1. Rising demand of Green Solvents in end-user industries
2.2.2. Developing economies
2.3. Market Restraints
2.3.1. Huge investment cost for start production
2.4. Market Opportunities
2.4.1. Support from the federal government
2.4.2. Implementation of regulatory framework in developing economies
2.5. Industry Value Chain Analysis
2.6. Pricing Analysis
2.7. Porter’s Five Forces Analysis
Chapter 3 Global Green Solvents Market, by Type
3.1. Market Overview, by Type
3.1.1. Global Green Solvents Market, by Type, 2016-2026 (USD Million)
3.1.2. Incremental Opportunity, by Type, 2018
3.2. Esters
3.2.1. Global Green Solvents Market, by Esters, 2016-2026, (USD Million)
3.3. Alcohols
3.3.1. Global Green Solvents Market, by Alcohols, 2016-2026, (USD Million)
3.4. Diols & glycols
3.4.1. Global Green Solvents Market, by Diols & glycols, 2016-2026, (USD Million)
3.5. D-Limonene
3.5.1. Global Green Solvents Market, by D-Limonene, 2016-2026, (USD Million)
Chapter 4 Global Green Solvents Market, by Application
4.1. Market Overview, by Application
4.1.1. Global Green Solvents Market, by Application, 2016-2026 (USD Million)
4.1.2. Incremental Opportunity, by Application, 2018
4.2. Adhesives & Sealants
4.2.1. Global Green Solvents Market, by Adhesives & Sealants, 2016-2026, (USD Million)
4.3. Printing Ink
4.3.1. Global Green Solvents Market, by Printing Ink, 2016-2026, (USD Million)
4.4. Industrial & Domestic Cleaners
4.4.1. Global Green Solvents Market, by Industrial & Domestic Cleaners, 2016-2026, (USD Million)
4.5. Paints & Coatings
4.5.1. Global Green Solvents Market, by Paints & Coatings, 2016-2026, (USD Million)
Chapter 5 Global Green Solvents Market, by Region
5.1. Market Overview, by Region
5.1.1. Global Green Solvents Market, by Region, 2016-2026, (USD Million)
5.1.2. Attractive Investment Opportunity, by Region, 2018
5.2. North America Green Solvents Market
5.2.1. North America Green Solvents Market, by Type, 2016-2026 (USD Million)
5.2.2. North America Green Solvents Market, by Application, 2016-2026 (USD Million)
5.2.3. United States Green Solvents Market, 2016-2026 (USD Million)
5.2.4. Canada Green Solvents Market, 2016-2026 (USD Million)
5.3. Europe Green Solvents Market
5.3.1. Europe Green Solvents Market, by Type, 2016-2026 (USD Million)
5.3.2. Europe Green Solvents Market, by Application, 2016-2026 (USD Million)
5.3.3. United Kingdom Green Solvents Market, 2016-2026 (USD Million)
5.3.4. Germany Green Solvents Market, 2016-2026 (USD Million)
5.3.5. France Green Solvents Market, 2016-2026 (USD Million)
5.3.6. Rest of Europe Green Solvents Market, 2016-2026 (USD Million)
5.4. Asia Pacific Green Solvents Market
5.4.1. Asia Pacific Green Solvents Market, by Type, 2016-2026 (USD Million)
5.4.2. Asia Pacific Green Solvents Market, by Application, 2016-2026 (USD Million)
5.4.3. China Green Solvents Market, 2016-2026 (USD Million)
5.4.4. Japan Green Solvents Market, 2016-2026 (USD Million)
5.4.5. India Green Solvents Market, 2016-2026 (USD Million)
5.4.6. Rest of Asia Pacific Green Solvents Market, 2016-2026 (USD Million)
5.5. Latin America Green Solvents Market
5.5.1. Latin America Green Solvents Market, by Type, 2016-2026 (USD Million)
5.5.2. Latin America Green Solvents Market, by Application, 2016-2026 (USD Million)
5.5.3. Brazil Green Solvents Market, 2016-2026 (USD Million)
5.5.4. Mexico Green Solvents Market, 2016-2026 (USD Million)
5.5.5. Rest of Latin America Green Solvents Market, 2016-2026 (USD Million)
5.6. Middle East & Africa Green Solvents Market
5.6.1. Middle East & Africa Green Solvents Market, by Type, 2016-2026 (USD Million)
5.6.2. Middle East & Africa Green Solvents Market, by Application, 2016-2026 (USD Million)
5.6.3. GCC Green Solvents Market, 2016-2026 (USD Million)
5.6.4. Rest of Middle East & Africa Green Solvents Market, 2016-2026 (USD Million)
Chapter 6 Competitive Intelligence
6.1. Top 5 Players Comparison
6.2. Market Positioning of Key Players, 2018
6.3. Market Players Mapping
6.3.1. By Type
6.3.2. By Application
6.3.3. By Region
6.4. Strategies Adopted by Key Market Players
6.5. Recent Developments in the Market
6.5.1. Mergers & Acquisitions, Partnership, New Type Developments
Chapter 7 Company Profiles
7.1. BASF SE
7.1.1. BASF SE Overview
7.1.2. BASF SE Product Portfolio
7.1.3. BASF SE Financial Overview
7.1.4. BASF SE News/Recent Developments
7.2. BioAmber Inc.
7.2.1. BioAmber Inc. Overview
7.2.2. BioAmber Inc. Product Portfolio
7.2.3. BioAmber Inc. Financial Overview
7.2.4. BioAmber Inc. News/Recent Developments
7.3. Myriant Corporation
7.3.1. Myriant Corporation Overview
7.3.2. Myriant Corporation Product Portfolio
7.3.3. Myriant Corporation Financial Overview
7.3.4. Myriant Corporation News/Recent Developments
7.4. Dow Chemicals
7.4.1. Dow Chemicals Overview
7.4.2. Dow Chemicals Product Portfolio
7.4.3. Dow Chemicals Financial Overview
7.4.4. Dow Chemicals News/Recent Developments
7.5. Cargill Incorporated
7.5.1. Cargill Incorporated Overview
7.5.2. Cargill Incorporated Product Portfolio
7.5.3. Cargill Incorporated Financial Overview
7.5.4. Cargill Incorporated News/Recent Developments
7.6. Gevo Inc.
7.6.1. Gevo Inc. Overview
7.6.2. Gevo Inc. Product Portfolio
7.6.3. Gevo Inc. Financial Overview
7.6.4. Gevo Inc. News/Recent Developments
7.7. Vertec Bio solvents Inc.
7.7.1. Vertec Bio solvents Inc. Overview
7.7.2. Vertec Bio solvents Inc. Product Portfolio
7.7.3. Vertec Bio solvents Inc. Financial Overview
7.7.4. Vertec Bio solvents Inc. News/Recent Developments
7.8. Florida Chemicals
7.8.1. Florida Chemicals Overview
7.8.2. Florida Chemicals Product Portfolio
7.8.3. Florida Chemicals Financial Overview
7.8.4. Florida Chemicals News/Recent Developments
7.9. Lyondellbasell
7.9.1. Lyondellbasell Overview
7.9.2. Lyondellbasell Product Portfolio
7.9.3. Lyondellbasell Financial Overview
7.9.4. Lyondellbasell News/Recent Developments
7.10. Solvay S.A
7.10.1. Solvay S.A Overview
7.10.2. Solvay S.A Product Portfolio
7.10.3. Solvay S.A Financial Overview
7.10.4. Solvay S.A News/Recent Developments
Chapter 8 Preface
8.1. Data Triangulation
8.2. Research Methodology
8.2.1. Phase I – Secondary Research
8.2.2. Phase II – Primary Research
8.2.3. Phase III – Expert Panel Review
8.2.4. Approach Adopted
8.2.4.1. Top-Down Approach
8.2.4.2. Bottom-Up Approach
8.2.5. Supply- Demand side
8.2.6. Breakup of the Primary Profiles


 Log in / Register


