Visual data discovery is an analytical tool that is used in analysing iterative visual data in order to make relevant business decisions. It helps in improving the decision-making process of an organization by examining data from charts and images. Data analyses can be performed in real time by using processes such as in-memory computing and fusion of multiple data sources. This process provides robust solutions to organizations due to the exponential growth of data.
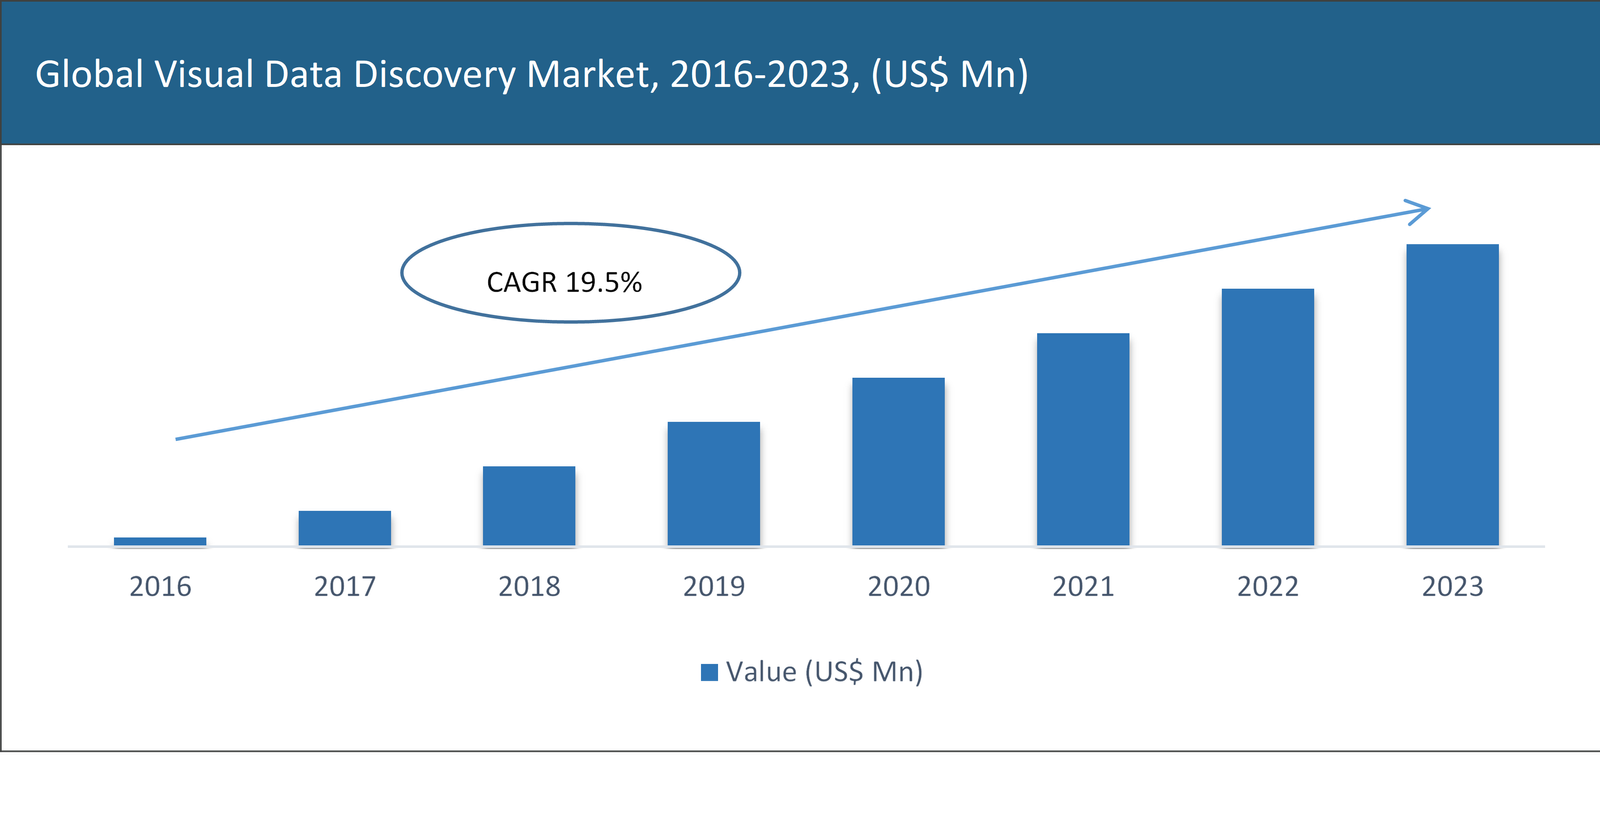
The global visual data discovery market is expected to grow at a CAGR of 19.5% during the forecast period. Organizations have access to large volumes of data that can be optimized to make relevant business strategies, in order to improve business prospects. But, owing to the large volume of data available, it is difficult for organizations to translate data into information. Visual data analytics is, therefore, used to integrate data from various sources and inspect them by making use of graphs, patterns, and trends, in order to provide practical business decisions.
The return on investment through visual data discovery is, however, questionable and this can hinder the market growth. But, the growing use of cloud-based services is increasing the amount of data, which will further accelerate the demand for visual data discovery market.
The market is segmented on the basis of region as North America, Europe, Asia Pacific, Latin America and Middle East & Africa. The North America region was dominating the visual data discovery market in the year 2018, owing to rising investments in cloud-based services. In addition to this, this region is an early adopter of emerging technologies, which further increases market demand. Moreover, the Asia-Pacific region is the fastest growing region during the forecast years, owing to the increasing use of data analytics in the SME sector.
The visual data discovery market is segmented on the basis of applications as risk management, cost optimization, customer experience management, supply chain management and procurement, social network analysis, asset management, sales and marketing optimization, and others. The risk management segment is expected to witness growth, owing to globalization and an unstable financial environment.
By Component Type
By Deployment Type
By Application
By Organization
By End User
Region
North America
U.S.
Canada
Mexico
Europe
U.K.
Germany
France
Spain
Italy
Rest of Europe
Asia Pacific
China
Japan
India
South Korea
Southeast Asia
Rest of APAC
LATAM
Brazil
Argentina
Rest of LATAM
Middle East Africa
South Africa
GCC
Rest of MEA
Key players in the market
Birst, Inc.
Clearstory Data
Datameer, Inc.
Datawatch Corporation
IBM Corporations
Microsoft Corporations
Oracle Corporations
Platfora, Inc.
Sas Institute
TIBCO Software Inc.

Ask for free product review call with the author

Share your specific research requirements for a customized report

Request for due diligence and consumer centric studies

Request for study updates, segment specific and country level reports
Table of Content
Chapter 1 Preface
1.1 Report Description
1.1.1 Purpose of the Report
1.1.2 Target Audience
1.1.3 USP and Key Offerings
1.2 Research Scope
1.3 Research Methodology
1.3.1 Phase I – Secondary Research
1.3.2 Phase II – Primary Research
1.3.3 Phase III – Expert Panel Review
1.3.4 Approach Adopted
1.3.4.1 Top-Down Approach
1.3.4.2 Bottom-Up Approach
1.3.5 Assumptions
1.4 Market Segmentation Scope
Chapter 2 Executive Summary
2.1 Market Summary
2.1.1 Global Visual Data Discovery Market, 2016-2023, (US$ Mn)
2.1 Market Snapshot: Global Visual Data Discovery Market
2.2 Market Dynamics
2.3 Global Visual Data Discovery Market, by Segment, 2018
2.3.1 Global Visual Data Discovery Market, by Component Type, 2018, (US$ Mn)
2.3.2 Global Visual Data Discovery Market, by Deployment Type, 2018, (US$ Mn)
2.3.3 Global Visual Data Discovery Market, by Application, 2018, (US$ Mn)
2.3.4 Global Visual Data Discovery Market, by Organization Size, 2018 (US$ Mn)
2.3.5 Global Visual Data Discovery Market, by End-use Industry, 2018 (US$ Mn)
2.3.6 Global Visual Data Discovery Market, by Region, 2018 (US$ Mn)
2.4 Premium Insights
2.4.1 Global Visual Data Discovery Market In Developed Vs. Developing Economies, 2018 vs 2023
2.4.2 Global Visual Data Discovery Market: Regional Life Cycle Analysis
Chapter 3 Market Dynamics
3.1 Market Overview
3.2 Market Drivers
3.2.1 Rising demand of data driven business decisions
3.2.2 Increasing sales and profits
3.2.3 Driver 3
3.3 Market Restraints
3.3.1 Unstable return on investments
3.3.2 Restraint 2
3.4 Market Opportunities
3.4.1 Increasing use machine learning by organizations
3.4.2 Opportunity 2
3.5 Industry Value Chain Analysis
3.5.1 Analyst’s Views
3.6 Industry SWOT Analysis
Chapter 4 Global Visual Data Discovery Market, by Component Type
4.1 Market Overview, by Component Type
4.1.1 Global Visual Data Discovery Market, by Component Type, 2016-2023 (US$ Mn)
4.1.2 Incremental Opportunity, by Component Type, From 2018-2023
4.2 Software
4.2.1 Global Visual Data Discovery Market, by Software, 2016-2023, (US$ Mn)
4.3 Services
4.3.1 Global Visual Data Discovery Market, by Services, 2016-2023, (US$ Mn)
Chapter 5 Global Visual Data Discovery Market, by Deployment Type
5.1 Market Overview, by Deployment Type
5.1.1 Global Visual Data Discovery Market, by Deployment Type, 2016-2023 (US$ Mn)
5.1.2 Incremental Opportunity, by Deployment Type, From 2018-2023
5.2 On-Premises
5.2.1 Global Visual Data Discovery Market, by On-Premises, 2016-2023, (US$ Mn)
5.3 Cloud Based
5.3.1 Global Visual Data Discovery Market, by Cloud Based, 2016-2023, (US$ Mn)
Chapter 6 Global Visual Data Discovery Market, by Application
6.1 Market Overview, by Application
6.1.1 Global Visual Data Discovery Market, by Application, 2016-2023 (US$ Mn)
6.1.2 Incremental Opportunity, by Application, From 2018-2023
6.2 Risk Management
6.2.1 Global Visual Data Discovery Market, by Risk Management, 2016-2023, (US$ Mn)
6.3 Customer Experience Management
6.3.1 Global Visual Data Discovery Market, by Customer Experience Management, 2016-2023, (US$ Mn)
6.4 Supply Chain Management and Procurement
6.4.1 Global Visual Data Discovery Market, by Supply Chain Management and Procurement, 2016-2023, (US$ Mn)
6.5 Asset Management
6.5.1 Global Visual Data Discovery Market, by Asset Management, 2016-2023, (US$ Mn)
6.6 Social Network Analysis
6.6.1 Global Visual Data Discovery Market, by Social Network Analysis, 2016-2023, (US$ Mn)
6.7 Cost Optimization
6.7.1 Global Visual Data Discovery Market, by Cost Optimization, 2016-2023, (US$ Mn)
6.8 Sales and Marketing Optimization
6.8.1 Global Visual Data Discovery Market, by Sales and Marketing Optimization, 2016-2023, (US$ Mn)
6.9 Others
6.9.1 Global Visual Data Discovery Market, by Others, 2016-2023, (US$ Mn)
Chapter 7 Global Visual Data Discovery Market, by Organization Size
7.1 Market Overview, by Organization Size
7.1.1 Global Visual Data Discovery Market, by Organization Size, 2016-2023 (US$ Mn)
7.1.2 Incremental Opportunity, by Organization Size, From 2018-2023
7.2 Small and Medium Enterprises
7.2.1 Global Visual Data Discovery Market, by Small and Medium Enterprises, 2016-2023, (US$ Mn)
7.3 Large Enterprises
7.3.1 Global Visual Data Discovery Market, by Large Enterprises, 2016-2023, (US$ Mn)
Chapter 8 Global Visual Data Discovery Market, by End-use Industry
8.1 Market Overview, by End-use Industry
8.1.1 Global Visual Data Discovery Market, by End-use Industry, 2016-2023 (US$ Mn)
8.1.2 Incremental Opportunity, by End-use Industry, From 2018-2023
8.2 BFSI
8.2.1 Global Visual Data Discovery Market, by BFSI, 2016-2023, (US$ Mn)
8.3 Retail and e-Commerce
8.3.1 Global Visual Data Discovery Market, by Retail and e-Commerce, 2016-2023, (US$ Mn)
8.4 Media & Entertainment
8.4.1 Global Visual Data Discovery Market, by Media & Entertainment, 2016-2023, (US$ Mn)
8.5 IT & Telecom
8.5.1 Global Visual Data Discovery Market, by IT & Telecom, 2016-2023, (US$ Mn)
8.6 Healthcare
8.6.1 Global Visual Data Discovery Market, by Healthcare, 2016-2023, (US$ Mn)
8.7 Government & Defense
8.7.1 Global Visual Data Discovery Market, by Government & Defense, 2016-2023, (US$ Mn)
8.8 Transportation & Logistics
8.8.1 Global Visual Data Discovery Market, by Transportation & Logistics, 2016-2023, (US$ Mn)
8.9 Others
8.9.1 Global Visual Data Discovery Market, by Others, 2016-2023, (US$ Mn)
Chapter 9 Global Visual Data Discovery Market, by Region
9.1 Market Overview, by Region
9.1.1 Global Visual Data Discovery Market, by Region, 2016-2023, (US$ Mn)
9.2 Attractive Investment Opportunity, by Region, 2018
9.3 North America Visual Data Discovery Market
9.3.1 North America Visual Data Discovery Market, by Component Type, 2016-2023 (US$ Mn)
9.3.2 North America Visual Data Discovery Market, by Deployment Type, 2016-2023 (US$ Mn)
9.3.3 North America Visual Data Discovery Market, by Application, 2016-2023 (US$ Mn)
9.3.4 North America Visual Data Discovery Market, by Organization Size, 2016-2023 (US$ Mn)
9.3.5 North America Visual Data Discovery Market, by End-use Industry, 2016-2023 (US$ Mn)
9.3.6 United States Country Profile
9.3.6.1 United States Visual Data Discovery Market, 2016-2023 (US$ Mn)
9.3.7 Canada Country Profile
9.3.7.1 Canada Visual Data Discovery Market, 2016-2023 (US$ Mn)
9.3.8 Mexico Country Profile
9.3.8.1 Mexico Visual Data Discovery Market, 2016-2023 (US$ Mn)
9.4 Europe Visual Data Discovery Market
9.4.1 Europe Visual Data Discovery Market, by Component Type, 2016-2023 (US$ Mn)
9.4.2 Europe Visual Data Discovery Market, by Deployment Type, 2016-2023 (US$ Mn)
9.4.3 Europe Visual Data Discovery Market, by Application, 2016-2023 (US$ Mn)
9.4.4 Europe Visual Data Discovery Market, by Organization Size, 2016-2023 (US$ Mn)
9.4.5 Europe Visual Data Discovery Market, by End-use Industry, 2016-2023 (US$ Mn)
9.4.6 United Kingdom Country Profile
9.4.6.1 United Kingdom Visual Data Discovery Market, 2016-2023 (US$ Mn)
9.4.7 Germany Country Profile
9.4.7.1 Germany Visual Data Discovery Market, 2016-2023 (US$ Mn)
9.4.8 France Country Profile
9.4.8.1 France Visual Data Discovery Market, 2016-2023 (US$ Mn)
9.4.9 Italy Country Profile
9.4.9.1 Italy Visual Data Discovery Market, 2016-2023 (US$ Mn)
9.4.10 Spain Country Profile
9.4.10.1 Spain Visual Data Discovery Market, 2016-2023 (US$ Mn)
9.4.11 Rest of Europe
9.4.11.1 Rest of Europe Visual Data Discovery Market, 2016-2023 (US$ Mn)
9.5 Asia Pacific Visual Data Discovery Market
9.5.1 Asia Pacific Visual Data Discovery Market, by Component Type, 2016-2023 (US$ Mn)
9.5.2 Asia Pacific Visual Data Discovery Market, by Deployment Type, 2016-2023 (US$ Mn)
9.5.3 Asia Pacific Visual Data Discovery Market, by Application, 2016-2023 (US$ Mn)
9.5.4 Asia Pacific Visual Data Discovery Market, by Organization Size, 2016-2023 (US$ Mn)
9.5.5 Asia Pacific Visual Data Discovery Market, by End-use Industry, 2016-2023 (US$ Mn)
9.5.6 China Country Profile
9.5.6.1 China Visual Data Discovery Market, 2016-2023 (US$ Mn)
9.5.7 Japan Country Profile
9.5.7.1 Japan Visual Data Discovery Market, 2016-2023 (US$ Mn)
9.5.8 India Country Profile
9.5.8.1 India Visual Data Discovery Market, 2016-2023 (US$ Mn)
9.5.9 South Korea Country Profile
9.5.9.1 South Korea Visual Data Discovery Market, 2016-2023 (US$ Mn)
9.5.10 Southeast Asia Country Profile
9.5.10.1 Southeast Asia Visual Data Discovery Market, 2016-2023 (US$ Mn)
9.5.11 Rest of Asia Pacific
9.5.11.1 Rest of Asia Pacific Visual Data Discovery Market, 2016-2023 (US$ Mn)
9.6 Latin America Visual Data Discovery Market
9.6.1 Latin America Visual Data Discovery Market, by Component Type, 2016-2023 (US$ Mn)
9.6.2 Latin America Visual Data Discovery Market, by Deployment Type, 2016-2023 (US$ Mn)
9.6.3 Latin America Visual Data Discovery Market, by Application, 2016-2023 (US$ Mn)
9.6.4 Latin America Visual Data Discovery Market, by Organization Size, 2016-2023 (US$ Mn)
9.6.5 Latin America Visual Data Discovery Market, by End-use Industry, 2016-2023 (US$ Mn)
9.6.6 Brazil Country Profile
9.6.6.1 Brazil Visual Data Discovery Market, 2016-2023 (US$ Mn)
9.6.7 Argentina Country Profile
9.6.7.1 Argentina Visual Data Discovery Market, 2016-2023 (US$ Mn)
9.6.8 Rest of Latin America
9.6.8.1 Rest of Latin America Visual Data Discovery Market, 2016-2023 (US$ Mn)
9.7 Middle East & Africa Visual Data Discovery Market
9.7.1 Middle East & Africa Visual Data Discovery Market, by Component Type, 2016-2023 (US$ Mn)
9.7.2 Middle East & Africa Visual Data Discovery Market, by Deployment Type, 2016-2023 (US$ Mn)
9.7.3 Middle East & Africa Visual Data Discovery Market, by Application, 2016-2023 (US$ Mn)
9.7.4 Middle East & Africa Visual Data Discovery Market, by Organization Size, 2016-2023 (US$ Mn)
9.7.5 Middle East & Africa Visual Data Discovery Market, by End-use Industry, 2016-2023 (US$ Mn)
9.7.6 Southern Africa
9.7.6.1 Southern Africa Visual Data Discovery Market, 2016-2023 (US$ Mn)
9.7.7 Northern Africa
9.7.7.1 Northern Africa Visual Data Discovery Market, 2016-2023 (US$ Mn)
9.7.8 GCC
9.7.8.1 GCC Visual Data Discovery Market, 2016-2023 (US$ Mn)
9.7.9 Rest of Middle East & Africa
9.7.9.1 Rest of Middle East & Africa Visual Data Discovery Market, 2016-2023 (US$ Mn)
Chapter 10 Competitive Intelligence
10.1 Market Positioning of Key Players, 2018
10.2 Market Players Mapping
10.2.1 By Component Type
10.2.2 By Deployment Type
10.2.1 By Application
10.2.2 By Organization Size
10.2.1 By End-use Industry
10.2.2 By Region
10.3 Strategies Adopted by Key Market Players
10.4 Recent Developments in the Market
10.4.1 Mergers & Acquisitions, Partnership, New Product Developments
10.5 Operational Efficiency Comparison by Key Players
Chapter 11 Company Profiles
11.1 Birst, Inc.
11.1.1 Birst, Inc. Overview
11.1.2 Key Stakeholders/Person in Datameer, Inc.
11.1.3 Birst, Inc. Products Portfolio
11.1.4 Birst, Inc. Financial Overview
11.1.5 Birst, Inc. News/Recent Developments
11.2 Clearstory Data
11.2.1 Clearstory Data Overview
11.2.2 Key Stakeholders/Person in Clearstory Data
11.2.3 Clearstory Data Products Portfolio
11.2.4 Clearstory Data Financial Overview
11.2.5 Clearstory Data News/Recent Developments
11.3 Datameer, Inc.
11.3.1 Datameer, Inc. Overview
11.3.2 Key Stakeholders/Person in Datameer, Inc.
11.3.3 Datameer, Inc. Products Portfolio
11.3.4 Datameer, Inc. Financial Overview
11.3.5 Datameer, Inc. News/Recent Developments
11.4 Datawatch Corporation
11.4.1 Datawatch Corporation Overview
11.4.2 Key Stakeholders/Person in Datawatch Corporation
11.4.3 Datawatch Corporation Products Portfolio
11.4.4 Datawatch Corporation Financial Overview
11.4.5 Datawatch Corporation News/Recent Developments
11.5 IBM Corporations
11.5.1 IBM Corporations Overview
11.5.2 Key Stakeholders/Person in IBM Corporations
11.5.3 IBM Corporations Products Portfolio
11.5.4 IBM Corporations Financial Overview
11.5.5 IBM Corporations News/Recent Developments
11.6 Microsoft Corporations
11.6.1 Microsoft Corporations Overview
11.6.2 Key Stakeholders/Person in Microsoft Corporations
11.6.3 Microsoft Corporations Products Portfolio
11.6.4 Microsoft Corporation’s Financial Overview
11.6.5 Microsoft Corporations News/Recent Developments
11.7 Oracle Corporations
11.7.1 Oracle Corporations Overview
11.7.2 Key Stakeholders/Person in Oracle Corporations
11.7.3 Oracle Corporations Products Portfolio
11.7.4 Oracle Corporations Financial Overview
11.7.5 Oracle Corporations News/Recent Developments
11.8 Platfora, Inc.
11.8.1 Platfora, Inc. Overview
11.8.2 Key Stakeholders/Person in Platfora, Inc.
11.8.3 Platfora, Inc. Products Portfolio
11.8.4 Platfora, Inc. Financial Overview
11.8.5 Platfora, Inc. News/Recent Developments
11.9 Sas Institute
11.9.1 Sas Institute Overview
11.9.2 Key Stakeholders/Person in Sas Institute
11.9.3 Sas Institute Products Portfolio
11.9.4 Sas Institute Financial Overview
11.9.5 Sas Institute News/Recent Developments
11.10 TIBCO Software Inc.
11.10.1 TIBCO Software Inc. Overview
11.10.2 Key Stakeholders/Person in TIBCO Software Inc.
11.10.3 TIBCO Software Inc. Products Portfolio
11.10.4 TIBCO Software Inc. Financial Overview
11.10.5 TIBCO Software Inc. News/Recent Developments


 Log in / Register


