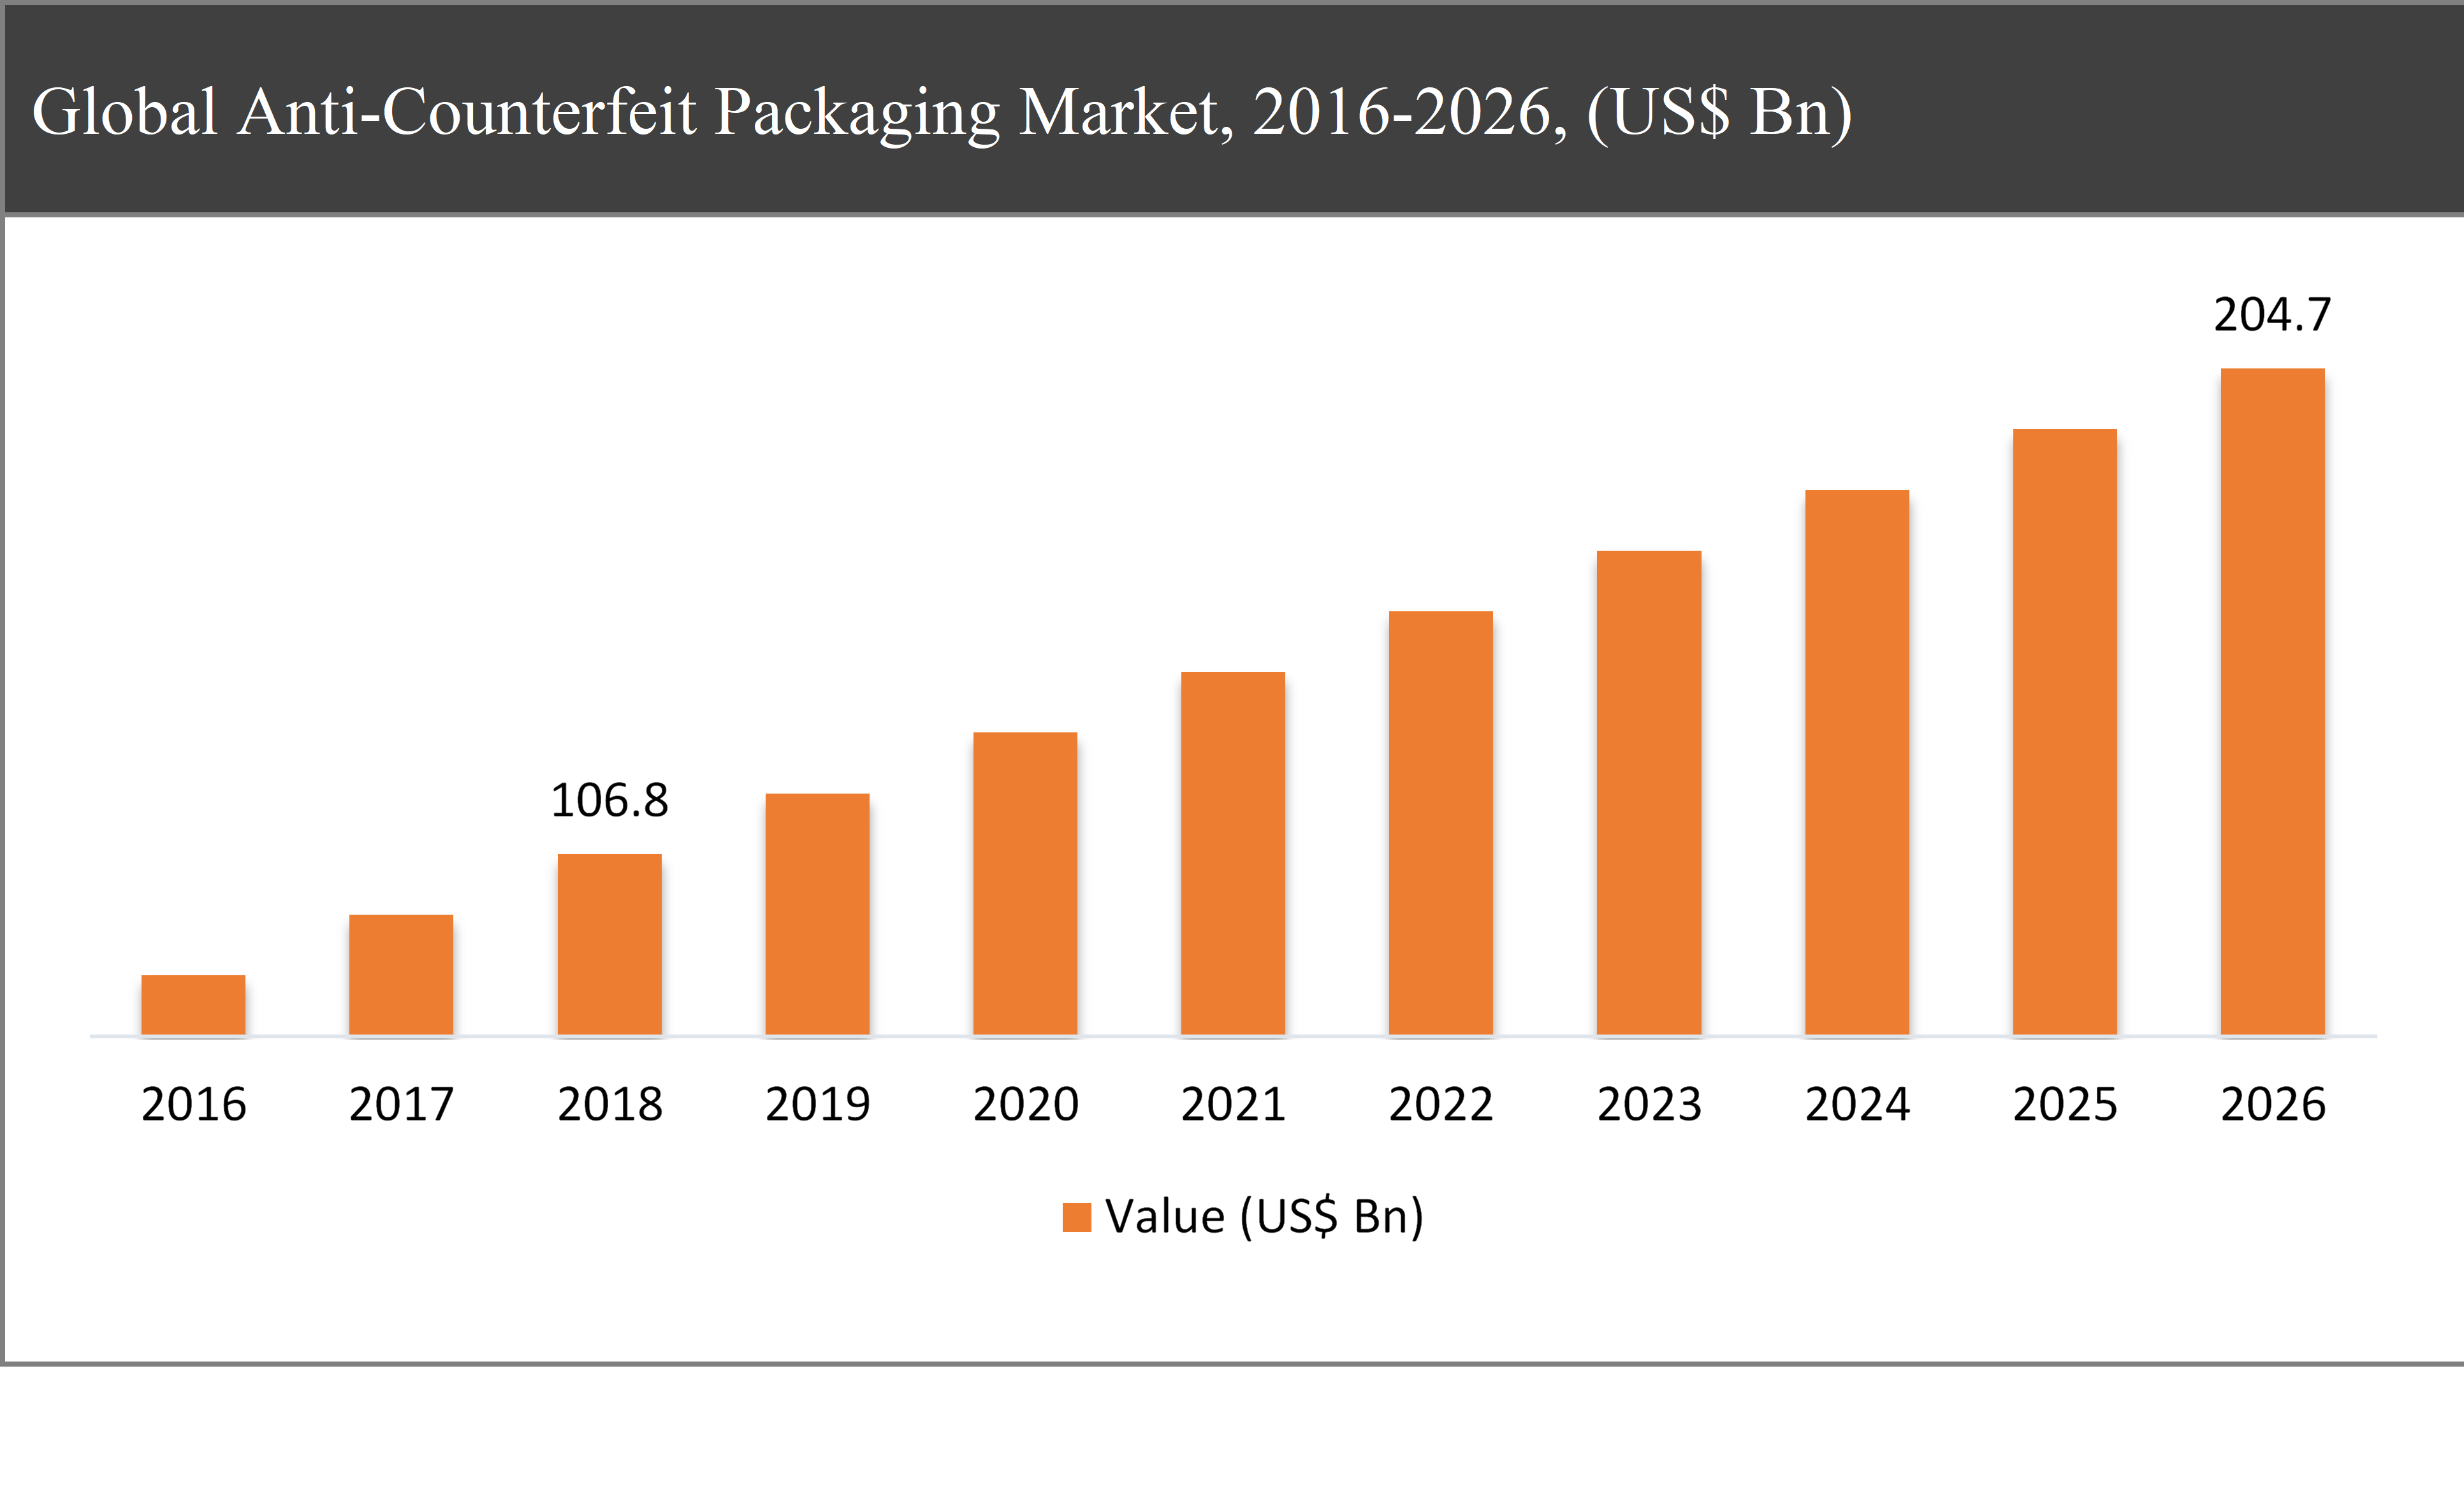
The global anti-counterfeit packaging market was valued at USD 106.8 Bn in 2018 and is expected to reach USD 204.7 Bn in 2026, growing at a CAGR of 8.4% during the forecast period.
Anti-counterfeit packaging is basically a process in which secure packaging is assigned to the product to minimize infringement. Prevention of imitation is one of the benefits offered by anti-counterfeiting packaging.
Anti-Counterfeit Packaging Market Segmentation |
|
| By Product | 1. RFID |
| 2. Barcode | |
| By Feature | 1. Overt |
| 2. Convert | |
| By End-use Industry | 1. Food & Beverages |
| 2. Healthcare | |
| 3. Others | |
| By Region | 1. North America (US and Canada) |
| 2. Europe (UK, Germany, France and Rest of Europe) | |
| 3. Asia Pacific (China, Japan, India and Rest of Asia Pacific) | |
| 4. Latin America (Brazil, Mexico and Rest of Latin America) | |
| 5. Middle East & Africa (GCC and Rest of Middle East & Africa) | |
The growth of the anti-counterfeit packaging market is primarily driven by the growth in the manufacturing industry. The anti-counterfeit packaging is witnessing elevated demand from the healthcare industry, owing to the growing concern of health safety increasing counterfeiting activities in the healthcare products manufacturing.
The RFID segment expected to dominate the market throughout the forecast period
Based on the product, the global anti-counterfeit packaging market has been segmented into RFID and Barcode. The RFID of anti-counterfeit packaging accounted for approximately 52% of the share in the global anti-counterfeit packaging market in 2018.
While barcode accounted highest CAGR of around 11 % in the global anti-counterfeit packaging market during the forecast period. Barcode is widely adopted for its cost-effectiveness. These benefits are expected to enhance the demand and sales for the barcode segment across the developed and developing countries in the global market.
Based on feature, the overt segment is expected to grow at a CAGR of around 10% throughout the forecast period
Based on the feature, the market has been segmented into overt and covert. The overt feature segment accounts of the largest share in the market and are expected to grow at a CAGR of around 10% during the forecast period.
Based on end-use industry, the food & beverage segment is expected to dominate during the forecast period
Based on end-use industry, the market has been segmented into food & beverage and healthcare among others. The food & beverage segment accounts of the largest share in the market and held for more than 35% of the total market in 2018. The major factors that are driving the growth of this segment are the rising demand for product standardization in the food and beverage industry across developing countries such as India, China, and Indonesia.
Asia-Pacific to dominate the anti-counterfeit packaging market throughout the forecast period
Asia-Pacific accounted for nearly 38% share of the global anti-counterfeit packaging market in 2018 and is expected to dominate the market throughout the forecast period. The rapid growth in the food & beverage sector in emerging economies such as China and India are one of the major driving factors for the region in the global market.
North America is expected to hold the highest CAGR in the global market during the forecast period. The manufacturers are investing in North American countries to meet the demand for the healthcare sector.
Company Profiles and Competitive Intelligence:
The major players operating in the global anti-counterfeit packaging market are Avery Dennison (US), CCL Industries Inc. (Canada), 3M Company (US), DuPont (US), Zebra Technologies Corporation (US), SICPA Holding SA (Switzerland), AlpVision S.A (Switzerland), Applied DNA Sciences Inc. (US), S Savi Technology, Inc. (US), and Authentix, Inc. (US) among others.

Ask for free product review call with the author

Share your specific research requirements for a customized report

Request for due diligence and consumer centric studies

Request for study updates, segment specific and country level reports
TABLE OF CONTENT
Chapter 1 Executive Summary
1.1. Market Summary
1.1.1. Global Anti-Counterfeit Packaging Market, 2016-2026, (USD Million)
1.2. Market Snapshot: Global Anti-Counterfeit Packaging Market
1.3. Market Dynamics
1.4. Global Anti-Counterfeit Packaging Market, by Segment, 2018
1.4.1. Global Anti-Counterfeit Packaging Market, by Product, 2018, (USD Million)
1.4.2. Global Anti-Counterfeit Packaging Market, by Feature, 2018, (USD Million)
1.4.3. Global Anti-Counterfeit Packaging Market, by End Use Industry, 2018, (USD Million)
1.4.4. Global Anti-Counterfeit Packaging Market, by Region, 2018 (USD Million)
1.5. Premium Insights
1.5.1. Anti-Counterfeit Packaging Market In Developed Vs. Developing Economies, 2018 vs 2023
1.5.2. Global Anti-Counterfeit Packaging Market: Regional Life Cycle Analysis
Chapter 2 Market Dynamics
2.1. Market Overview
2.2. Market Drivers
2.2.1. Rise in product safety concern regarding product packaging
2.2.2. Increase in demand from pharmaceutical industry
2.3. Market Restraints
2.3.1. Fluctuating prices of raw material
2.3.2. High cost of R&D
2.4. Market Opportunities
2.4.1. Advancements in technology
2.4.2. Growing opportunities in emerging economies
2.5. Industry Value Chain Analysis
2.6. Pricing Analysis
2.7. Porter’s Five Forces Analysis
Chapter 3 Global Anti-Counterfeit Packaging Market, by Product
3.1. Market Overview, by Product
3.1.1. Global Anti-Counterfeit Packaging Market, by Country, 2016-2026 (USD Million)
3.1.2. Incremental Opportunity, by Product, 2018
3.2. RFID
3.2.1. Global Anti-Counterfeit Packaging Market, by RFID, 2016-2026, (USD Million)
3.3. Barcode
3.3.1. Global Anti-Counterfeit Packaging Market, by Barcode, 2016-2026, (USD Million)
Chapter 4 Global Anti-Counterfeit Packaging Market, by Feature
4.1. Market Overview, by Feature
4.1.1. Global Anti-Counterfeit Packaging Market, by Feature, 2016-2026 (USD Million)
4.1.2. Incremental Opportunity, by Feature, 2018
4.2. Overt
4.2.1. Global Anti-Counterfeit Packaging Market, by Overt, 2016-2026, (USD Million)
4.3. Covert
4.3.1. Global Anti-Counterfeit Packaging Market, by Covert, 2016-2026, (USD Million)
Chapter 5 Global Anti-Counterfeit Packaging Market, by End Use Industry
5.1. Market Overview, by End Use Industry
5.1.1. Global Anti-Counterfeit Packaging Market, by End Use Industry, 2016-2026 (USD Million)
5.1.2. Incremental Opportunity, by End Use Industry, 2018
5.2. Food & Beverages
5.2.1. Global Anti-Counterfeit Packaging Market, by Food & Beverages, 2016-2026, (USD Million)
5.3. Healthcare
5.3.1. Global Anti-Counterfeit Packaging Market, by Healthcare, 2016-2026, (USD Million)
5.4. Others
5.4.1. Global Anti-Counterfeit Packaging Market, by Others, 2016-2026, (USD Million)
Chapter 6 Global Anti-Counterfeit Packaging Market, by Region
6.1. Market Overview, by Region
6.1.1. Global Anti-Counterfeit Packaging Market, by Region, 2016-2026, (USD Million)
6.2. Attractive Investment Opportunity, by Region, 2018
6.2.1. North America Anti-Counterfeit Packaging Market by Product 2016-2026 (USD Million)
6.2.2. North America Anti-Counterfeit Packaging Market by Feature 2016-2026 (USD Million)
6.2.3. North America Anti-Counterfeit Packaging Market, by End Use Industry 2016-2026 (USD Million)
6.2.4. United States Anti-Counterfeit Packaging Market, 2016-2026 (USD Million)
6.2.5. Canada Anti-Counterfeit Packaging Market, 2016-2026 (USD Million)
6.3. Europe Anti-Counterfeit Packaging Market
6.3.1. Europe Anti-Counterfeit Packaging Market by Product 2016-2026 (USD Million)
6.3.2. Europe Anti-Counterfeit Packaging Market by Feature 2016-2026 (USD Million)
6.3.3. Europe Anti-Counterfeit Packaging Market, by End Use Industry 2016-2026 (USD Million)
6.3.4. United Kingdom Anti-Counterfeit Packaging Market, 2016-2026 (USD Million)
6.3.5. Germany Anti-Counterfeit Packaging Market, 2016-2026 (USD Million)
6.3.6. France Anti-Counterfeit Packaging Market, 2016-2026 (USD Million)
6.3.7. Rest of Europe Anti-Counterfeit Packaging Market, 2016-2026 (USD Million)
6.4. Asia Pacific Anti-Counterfeit Packaging Market
6.4.1. Asia Pacific Anti-Counterfeit Packaging Market by Product 2016-2026 (USD Million)
6.4.2. Asia Pacific Anti-Counterfeit Packaging Market by Feature 2016-2026 (USD Million)
6.4.3. Asia Pacific Anti-Counterfeit Packaging Market, by End Use Industry 2016-2026 (USD Million)
6.4.4. China Anti-Counterfeit Packaging Market, 2016-2026 (USD Million)
6.4.5. Japan Anti-Counterfeit Packaging Market, 2016-2026 (USD Million)
6.4.6. India Anti-Counterfeit Packaging Market, 2016-2026 (USD Million)
6.4.7. Rest of Asia Pacific Anti-Counterfeit Packaging Market, 2016-2026 (USD Million)
6.5. Latin America Anti-Counterfeit Packaging Market
6.5.1. Latin America Anti-Counterfeit Packaging Market by Product 2016-2026 (USD Million)
6.5.2. Latin America Anti-Counterfeit Packaging Market by Feature 2016-2026 (USD Million)
6.5.3. Latin America Anti-Counterfeit Packaging Market, by End Use Industry 2016-2026 (USD Million)
6.5.4. Brazil Anti-Counterfeit Packaging Market, 2016-2026 (USD Million)
6.5.5. Mexico Anti-Counterfeit Packaging Market, 2016-2026 (USD Million)
6.5.6. Rest of Latin America Anti-Counterfeit Packaging Market, 2016-2026 (USD Million)
6.6. Middle East & Africa Anti-Counterfeit Packaging Market
6.6.1. Middle East & Africa Anti-Counterfeit Packaging Market by Product 2016-2026 (USD Million)
6.6.2. Middle East & Africa Anti-Counterfeit Packaging Market by Feature 2016-2026 (USD Million)
6.6.3. Middle East & Africa Anti-Counterfeit Packaging Market, by End Use Industry 2016-2026 (USD Million)
6.6.4. GCC Anti-Counterfeit Packaging Market, 2016-2026 (USD Million)
6.6.5. Rest of Middle East & Africa Anti-Counterfeit Packaging Market, 2016-2026 (USD Million)
Chapter 7 Competitive Intelligence
7.1. Top 5 Players Comparison
7.2. Market Positioning of Key Players, 2018
7.3. Market Players Mapping
7.3.1. By Product
7.3.2. By Feature
7.3.3. By End Use Industry
7.3.4. By Region
7.4. Strategies Adopted by Key Market Players
7.5. Recent Developments in the Market
7.5.1. Mergers & Acquisitions, Partnership, New Product Developments
Chapter 8 Company Profiles
8.1. Avery Dennison Corporation
8.1.1. Avery Dennison Corporation Overview
8.1.2. Avery Dennison Corporation Products Portfolio
8.1.3. Avery Dennison Corporation Financial Overview
8.1.4. Avery Dennison Corporation News/Recent Developments
8.2. CCL Industries Inc.
8.2.1. CCL Industries Inc. Overview
8.2.2. CCL Industries Inc. Products Portfolio
8.2.3. CCL Industries Inc. Financial Overview
8.2.4. CCL Industries Inc. News/Recent Developments
8.3. 3M Company
8.3.1. 3M Company Overview
8.3.2. 3M Company Products Portfolio
8.3.3. 3M Company Financial Overview
8.3.4. 3M Company News/Recent Developments
8.4. DuPont
8.4.1. DuPont Overview
8.4.2. DuPont Products Portfolio
8.4.3. DuPont Financial Overview
8.4.4. DuPont News/Recent Developments
8.5. ALPVISION S.A
8.5.1. ALPVISION S.A Overview
8.5.2. ALPVISION S.A Products Portfolio
8.5.3. ALPVISION S.A Financial Overview
8.5.4. ALPVISION S.A News/Recent Developments
8.6. Zebra Technologies Corporation
8.6.1. Zebra Technologies Corporation Overview
8.6.2. Zebra Technologies Corporation Products Portfolio
8.6.3. Zebra Technologies Corporation Financial Overview
8.6.4. Zebra Technologies Corporation News/Recent Developments
8.7. SICPA HOLDING SA
8.7.1. SICPA HOLDING SA Overview
8.7.2. SICPA HOLDING SA Products Portfolio
8.7.3. SICPA HOLDING SA Financial Overview
8.7.4. SICPA HOLDING SA News/Recent Developments
8.8. Applied DNA Sciences Inc.
8.8.1. Applied DNA Sciences Inc. Overview
8.8.2. Applied DNA Sciences Inc. Products Portfolio
8.8.3. Applied DNA Sciences Inc. Financial Overview
8.8.4. Applied DNA Sciences Inc. News/Recent Developments
8.9. SAVI Technology, Inc.
8.9.1. SAVI Technology, Inc. Overview
8.9.2. SAVI Technology, Inc. Products Portfolio
8.9.3. SAVI Technology, Inc. Financial Overview
8.9.4. SAVI Technology, Inc. News/Recent Developments
8.10. Authentix, Inc.
8.10.1. Authentix, Inc. Overview
8.10.2. Authentix, Inc. Products Portfolio
8.10.3. Authentix, Inc. Financial Overview
8.10.4. Authentix, Inc. News/Recent Developments
Chapter 9 Preface
9.1. Data Triangulation
9.2. Research Methodology
9.2.1. Phase I – Secondary Research
9.2.2. Phase II – Primary Research
9.2.3. Phase III – Expert Panel Review
9.2.4. Approach Adopted
9.2.4.1. Top-Down Approach
9.2.4.2. Bottom-Up Approach
9.2.5. Supply- Demand side
9.2.6. Breakup of the Primary Profiles


 Log in / Register


