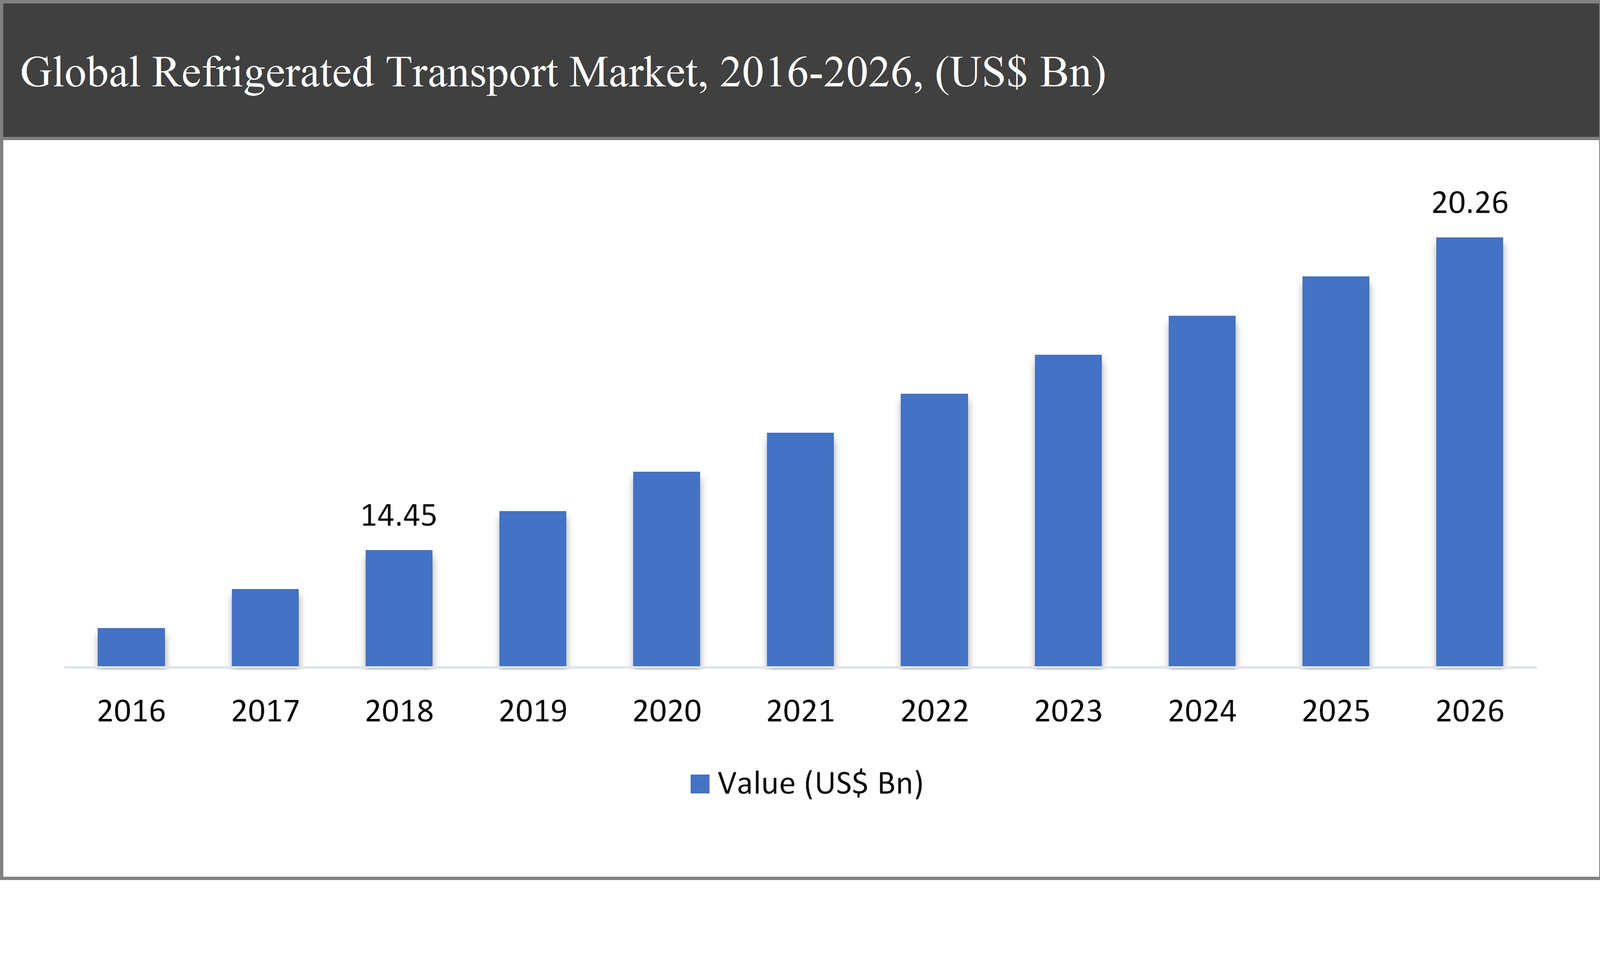
The global refrigerated transport market was valued at USD 14.45 billion in 2018 and is expected to reach USD 20.26 billion in 2026, growing at a CAGR of 4.3% during the forecast period.
Refrigerated Transport is important nowadays to preserve and protect the drugs, foods, and medical and made refrigerated transport an essential part of the supply chain. Refrigerated transport is a mode of transport of perishable food products which includes meat, dairy products, fresh fruits and vegetables, pharmaceuticals, and confectionery items by preserving them at low temperatures.
Refrigerated Transport Market Segmentation |
|
| By Product Type | 1. Chilled food products |
| 2. Frozen food products | |
| By Temperature | 1. Single-Temperature |
| 2. Multi-Temperature | |
| By Technology | 1. Vapor Compression Systems |
| 2. Cryogenic System | |
| By Vehicle Type | 1. Light Commercial Vehicle (LCV) |
| 2. Medium Commercial Vehicle (MCV) | |
| 3. Heavy Commercial Vehicle (HCV) | |
| By Region | 1. North America (US and Canada) |
| 2. Europe (UK, Germany, France and Rest of Europe) | |
| 3. Asia Pacific (China, Japan, India and Rest of Asia Pacific) | |
| 4. Latin America (Brazil, Mexico and Rest of Latin America) | |
| 5. Middle East & Africa (GCC and Rest of Middle East & Africa) | |
The growth of the refrigerated transport market is primarily driven by stringent regulation pertaining to processing, production, transport, and quality of frozen foods and growing demand for frozen food products, and technological advancement in refrigerated equipment and products. Moreover, rising advantages of refrigerated transport which includes the transport of fresh food products protect from damage and spoilage, temperature adjustment with respect to products also drives the growth of the global refrigerated transport market. On the other hand, climate variations reduce the efficiency of transport and huge initial investment is creating a major hindrance for its market growth. However, continuous development in the multi-temperature system in trailers and trucks and a new mode of transport to save fuel costs is expected to create major growth opportunities during the forecast period.
The chilled food products segment expected to grow at the fastest rate of 6.8% CAGR during the forecast period
Based on product type, the global refrigerated transport market has been segmented into chilled food products and frozen food products. Chilled products such as bakery & confectionery products, dairy products, beverages, and fresh fruits & vegetables. The growing demand for these products in emerging economies and growing awareness regarding perishable and sealed food products further grows the demand for chilled food products. Furthermore, growing supermarket and food supply chain across the globe creates opportunities for chilled food products manufactures and refrigerated transport providers during the forecast period. Due to these factors, chilled food products segment is expected to grow at the fastest rate throughout the forecast period.
Based on temperature, the single-temperature segment is expected to lead during the forecast period
Based on temperature, the market has been segmented into single-temperature and multi-temperature. The single-temperature segment accounted for the largest share of approximately 58% in the market in 2018, which is expected that the multi temperature are expected to overcome the dominance of single temperature in the coming years. Single-temperature refrigerated transport is an ideal solution for fresh fruits and vegetables, meat, fish, dairy products, and pharmaceuticals. Again, single-temperature refrigerated transport offers one single temperature for transporting perishable goods.
Based on technology, the light commercial vehicle segment is expected to lead during the forecast period
Based on technology, the market has been segmented into vapor compression systems and cryogenic system. The vapor compression systems segment accounted for the largest share in the market in 2018. Vapor compression systems are mainly used in refrigeration equipment and to preserve the frozen products which offer effective and efficient refrigeration.
Based on vehicle type, the light commercial vehicle segment is expected to lead during the forecast period
Based on vehicle type, the market has been segmented into light commercial vehicle (LCV), medium commercial vehicle (MCV), and heavy commercial vehicle (HCV). The light commercial vehicle (LCV) segment accounted for the largest share in the market in 2018. Light commercial vehicle (LCV) is mainly used for transporting food products and growing demand for short-distance transportation and home delivery services.
Asia-Pacific to dominate the refrigerated transport market throughout the forecast period
Asia-Pacific accounted for nearly 38% share of the global refrigerated transport market in 2018 and is expected to dominate the market throughout the forecast period followed by Europe and North America. Strong economic growth in the Asia-Pacific region is one of the key factors driving the consumption of refrigerated transport in this region. Moreover, growing investment by the government in transport infrastructure development projects and the growth of construction, automotive and transport industry in key countries such as Japan, India, and China are also propelling the growth of refrigerated transport in the Asia-Pacific region. While Europe accounted for the highest CAGR in the global Refrigerated Transport market during the forecast period.
Company Profiles and Competitive Intelligence:
The major players operating in the global refrigerated transport market are Daikin Industries Ltd. (Japan), Ingersoll Rand Plc (Ireland), United Technologies Corporation (US), China International Marine Containers (Group) Ltd. (China), Schmitz Cargobull (Germany), Singamas Container (Hong Kong), Fahrzeugwerk Bernard Krone (Germany), Lamberet (France), Utility Trailer (US), and Hyundai (South Korea) among others.

Ask for free product review call with the author

Share your specific research requirements for a customized report

Request for due diligence and consumer centric studies

Request for study updates, segment specific and country level reports
Chapter 1 Executive Summary
1.1. Market Summary
1.1.1. Global Refrigerated Transport Market, 2016-2026, (USD Million)
1.2. Market Snapshot: Global Refrigerated Transport Market
1.3. Market Dynamics
1.4. Global Refrigerated Transport Market, by Segment, 2018
1.4.1. Global Refrigerated Transport Market, by Product Type, 2018, (USD Million)
1.4.2. Global Refrigerated Transport Market, by Temperature, 2018, (USD Million)
1.4.3. Global Refrigerated Transport Market, by Technology, 2018, (USD Million)
1.4.4. Global Refrigerated Transport Market, by Vehicle Type, 2018, (USD Million)
1.4.5. Global Refrigerated Transport Market, by Region, 2018 (USD Million)
1.5. Premium Insights
1.5.1. Refrigerated Transport Market In Developed Vs. Developing Economies, 2018 vs 2026
1.5.2. Global Refrigerated Transport Market: Regional Life Cycle Analysis
Chapter 2 Market Dynamics
2.1. Market Overview
2.2. Market Drivers
2.2.1. Stringent regulation pertaining to processing, production, transport, and quality of frozen foods
2.2.2. Growing demand for frozen food products
2.3. Market Restraints
2.3.1. Climate variations reduce the efficiency of transport
2.3.2. Huge initial investment
2.4. Market Opportunities
2.4.1. Continuous development in multi-temperature system in trailers and trucks
2.5. Industry Value Chain Analysis
2.6. Pricing Analysis
2.7. Porter’s Five Forces Analysis
Chapter 3 Global Refrigerated Transport Market, by Product Type
3.1. Market Overview, by Product Type
3.1.1. Global Refrigerated Transport Market, by Country, 2016-2026 (USD Million)
3.1.2. Incremental Opportunity, by Product Type, 2018
3.2. Chilled food products
3.2.1. Global Refrigerated Transport Market, by Chilled food products, 2016-2026, (USD Million)
3.3. Frozen food products
3.3.1. Global Refrigerated Transport Market, by Frozen food products, 2016-2026, (USD Million)
Chapter 4 Global Refrigerated Transport Market, by Temperature
4.1. Market Overview, by Temperature
4.1.1. Global Refrigerated Transport Market, by Temperature, 2016-2026 (USD Million)
4.1.2. Incremental Opportunity, by Temperature, 2018
4.2. Single-Temperature
4.2.1. Global Refrigerated Transport Market, by Single-Temperature, 2016-2026, (USD Million)
4.3. Multi-Temperature
4.3.1. Global Refrigerated Transport Market, by Multi-Temperature, 2016-2026, (USD Million)
Chapter 5 Global Refrigerated Transport Market, by Technology
5.1. Market Overview, by Technology
5.1.1. Global Refrigerated Transport Market, by Technology, 2016-2026 (USD Million)
5.1.2. Incremental Opportunity, by Technology, 2018
5.2. Vapor Compression Systems
5.2.1. Global Refrigerated Transport Market, by Vapor Compression Systems, 2016-2026, (USD Million)
5.3. Cryogenic System
5.3.1. Global Refrigerated Transport Market, by Cryogenic System, 2016-2026, (USD Million)
Chapter 6 Global Refrigerated Transport Market, by Vehicle Type
6.1. Market Overview, by Vehicle Type
6.1.1. Global Refrigerated Transport Market, by Vehicle Type, 2016-2026 (USD Million)
6.1.2. Incremental Opportunity, by Vehicle Type, 2018
6.2. Light Commercial Vehicle (LCV)
6.2.1. Global Refrigerated Transport Market, by Light Commercial Vehicle (LCV), 2016-2026, (USD Million)
6.3. Medium Commercial Vehicle (MCV)
6.3.1. Global Refrigerated Transport Market, by Medium Commercial Vehicle (MCV), 2016-2026, (USD Million)
6.4. Heavy Commercial Vehicle (HCV)
6.4.1. Global Refrigerated Transport Market, by Heavy Commercial Vehicle (HCV), 2016-2026, (USD Million)
Chapter 7 Global Refrigerated Transport Market, by Region
7.1. Market Overview, by Region
7.1.1. Global Refrigerated Transport Market, by Region, 2016-2026, (USD Million)
7.2. Attractive Investment Opportunity, by Region, 2018
7.3. North America Refrigerated Transport Market
7.3.1. North America Refrigerated Transport Market, by Product Type, 2016-2026 (USD Million)
7.3.2. North America Refrigerated Transport Market, by Temperature, 2016-2026 (USD Million)
7.3.3. North America Refrigerated Transport Market, by Technology, 2016-2026 (USD Million)
7.3.4. North America Refrigerated Transport Market, by Vehicle Type, 2016-2026 (USD Million)
7.3.5. United States Refrigerated Transport Market, 2016-2026 (USD Million)
7.3.6. Canada Refrigerated Transport Market, 2016-2026 (USD Million)
7.4. Europe Refrigerated Transport Market
7.4.1. Europe Refrigerated Transport Market, by Product Type, 2016-2026 (USD Million)
7.4.2. Europe Refrigerated Transport Market, by Temperature, 2016-2026 (USD Million)
7.4.3. Europe Refrigerated Transport Market, by Technology, 2016-2026 (USD Million)
7.4.4. Europe Refrigerated Transport Market, by Vehicle Type, 2016-2026 (USD Million)
7.4.5. United Kingdom Refrigerated Transport Market, 2016-2026 (USD Million)
7.4.6. Germany Refrigerated Transport Market, 2016-2026 (USD Million)
7.4.7. France Refrigerated Transport Market, 2016-2026 (USD Million)
7.4.8. Rest of Europe Refrigerated Transport Market, 2016-2026 (USD Million)
7.5. Asia Pacific Refrigerated Transport Market
7.5.1. Asia Pacific Refrigerated Transport Market, by Product Type, 2016-2026 (USD Million)
7.5.2. Asia Pacific Refrigerated Transport Market, by Temperature, 2016-2026 (USD Million)
7.5.3. Asia Pacific Refrigerated Transport Market, by Technology, 2016-2026 (USD Million)
7.5.4. Asia Pacific Refrigerated Transport Market, by Vehicle Type, 2016-2026 (USD Million)
7.5.5. China Refrigerated Transport Market, 2016-2026 (USD Million)
7.5.6. Japan Refrigerated Transport Market, 2016-2026 (USD Million)
7.5.7. India Refrigerated Transport Market, 2016-2026 (USD Million)
7.5.8. Rest of Asia Pacific Refrigerated Transport Market, 2016-2026 (USD Million)
7.6. Latin America Refrigerated Transport Market
7.6.1. Latin America Refrigerated Transport Market, by Product Type, 2016-2026 (USD Million)
7.6.2. Latin America Refrigerated Transport Market, by Temperature, 2016-2026 (USD Million)
7.6.3. Latin America Refrigerated Transport Market, by Technology, 2016-2026 (USD Million)
7.6.4. Latin America Refrigerated Transport Market, by Vehicle Type, 2016-2026 (USD Million)
7.6.5. Brazil Refrigerated Transport Market, 2016-2026 (USD Million)
7.6.6. Mexico Refrigerated Transport Market, 2016-2026 (USD Million)
7.6.7. Rest of Latin America Refrigerated Transport Market, 2016-2026 (USD Million)
7.7. Middle East & Africa Refrigerated Transport Market
7.7.1. Middle East & Africa Refrigerated Transport Market, by Product Type, 2016-2026 (USD Million)
7.7.2. Middle East & Africa Refrigerated Transport Market, by Temperature, 2016-2026 (USD Million)
7.7.3. Middle East & Africa Refrigerated Transport Market, by Technology, 2016-2026 (USD Million)
7.7.4. Middle East & Africa Refrigerated Transport Market, by Vehicle Type, 2016-2026 (USD Million)
7.7.5. GCC Refrigerated Transport Market, 2016-2026 (USD Million)
7.7.6. Rest of Middle East & Africa Refrigerated Transport Market, 2016-2026 (USD Million)
Chapter 8 Competitive Intelligence
8.1. Top 5 Players Comparison
8.2. Market Positioning of Key Players, 2018
8.3. Market Players Mapping
8.3.1. By Product Type
8.3.2. By Temperature
8.3.3. By Technology
8.3.4. By Vehicle Type
8.3.5. By Region
8.4. Strategies Adopted by Key Market Players
8.5. Recent Developments in the Market
8.5.1. Mergers & Acquisitions, Partnership, New Product Type Developments
Chapter 9 Company Profiles
9.1. Daikin Industries Ltd.
9.1.1. Daikin Industries Ltd. Overview
9.1.2. Daikin Industries Ltd. Product Types Portfolio
9.1.3. Daikin Industries Ltd. Financial Overview
9.1.4. Daikin Industries Ltd. News/Recent Developments
9.2. Ingersoll Rand Plc
9.2.1. Ingersoll Rand Plc Overview
9.2.2. Ingersoll Rand Plc Product Types Portfolio
9.2.3. Ingersoll Rand Plc Financial Overview
9.2.4. Ingersoll Rand Plc News/Recent Developments
9.3. UNITED TECHNOLOGIES CORPORATION
9.3.1. UNITED TECHNOLOGIES CORPORATION Overview
9.3.2. UNITED TECHNOLOGIES CORPORATION Product Types Portfolio
9.3.3. UNITED TECHNOLOGIES CORPORATION Financial Overview
9.3.4. UNITED TECHNOLOGIES CORPORATION News/Recent Developments
9.4. China International Marine Containers (Group) Ltd.
9.4.1. China International Marine Containers (Group) Ltd. Overview
9.4.2. China International Marine Containers (Group) Ltd. Product Types Portfolio
9.4.3. China International Marine Containers (Group) Ltd. Financial Overview
9.4.4. China International Marine Containers (Group) Ltd. News/Recent Developments
9.5. Schmitz Cargobull
9.5.1. Schmitz Cargobull Overview
9.5.2. Schmitz Cargobull Product Types Portfolio
9.5.3. Schmitz Cargobull Financial Overview
9.5.4. Schmitz Cargobull News/Recent Developments
9.6. Singamas Container
9.6.1. Singamas Container Overview
9.6.2. Singamas Container Product Types Portfolio
9.6.3. Singamas Container Financial Overview
9.6.4. Singamas Container News/Recent Developments
9.7. Fahrzeugwerk Bernard Krone
9.7.1. Fahrzeugwerk Bernard Krone Overview
9.7.2. Fahrzeugwerk Bernard Krone Product Types Portfolio
9.7.3. Fahrzeugwerk Bernard Krone Financial Overview
9.7.4. Fahrzeugwerk Bernard Krone News/Recent Developments
9.8. Lamberet
9.8.1. Lamberet Overview
9.8.2. Lamberet Product Types Portfolio
9.8.3. Lamberet Financial Overview
9.8.4. Lamberet News/Recent Developments
9.9. Utility Trailer
9.9.1. Utility Trailer Overview
9.9.2. Utility Trailer Product Types Portfolio
9.9.3. Utility Trailer Financial Overview
9.9.4. Utility Trailer News/Recent Developments
9.10. Hyundai
9.10.1. Hyundai Overview
9.10.2. Hyundai Product Types Portfolio
9.10.3. Hyundai Financial Overview
9.10.4. Hyundai News/Recent Developments
Chapter 10 Preface
10.1. Data Triangulation
10.2. Research Methodology
10.2.1. Phase I – Secondary Research
10.2.2. Phase II – Primary Research
10.2.3. Phase III – Expert Panel Review
10.2.4. Approach Adopted
10.2.4.1. Top-Down Approach
10.2.4.2. Bottom-Up Approach
10.2.5. Supply- Demand side
10.2.6. Breakup of the Primary Profiles


 Log in / Register


