Global AR VR in Logistics and Supply Chain Market Ecosystem By Raw Material; By Components; By Product, Parts & Devices; By Services & Solutions; By Application (3D modelling/ Design, Training, Others); By Region & Forecast by 2023

Evaluation of AR VR in Logistics and Supply Chain Market Ecosystem:

The global AR VR in logistics and supply chain market ecosystem was valued at US$ 78.5 Mn in 2018 and is expected to reach US$ XX Mn with a CAGR of 39% by 2023. Augmented reality’s ability to avoid the wastage of time and errors while searching the location in warehouses has been creating demand for AR VR in logistics and supply chain in recent years. Additionally, the ability of AR VR to save cost and time for training workers is increasing the use of AR in warehouses for wayfinding.

Moreover, virtual reality is used in warehouses for training workers on safety and emergency in a warehouse environment. This is increasing the demand for VR in warehouses. The German logistics provider DB Schenker, in collaboration with Fraunhofer IML, has announced the use of VR for employee training in order to improve order picking and packaging processes.

Ecosystem Snapshot: AR VR in Logistics and Supply Chain Market Overview

AR VR in Logistics and Supply Chain Market

Head-mounted display dominated the product, parts & devices segment and was valued at US$ 45.63 Mn in 2018 and is expected to grow with a CAGR of XX% in the coming years. HMD is used for real-time object recognition, indoor navigation, and barcode reading, which provide seamless integration of information with the warehouse management system. At the same time, hand mounted devices also provide hands- free intuitive digital support to workers during their manual picking operations, which has been driving the demand for HMDs in recent years.

At the same time, companies such as Google, Recon, Vuzix, Kopin, and others are focusing on introducing smart glasses in order to improve the accuracy and efficiency of warehouse logistics operations. Owing to the benefits offered by smart glasses, logistics companies have increased the use of smart glasses in recent times. DHL increased its productivity by 15% in 2017 by using smart glasses in their operational processes, as smart glasses provide order picking instructions along with information regarding the location of items in warehouses.

AR VR in Logistics and Supply Chain Market Ecosystem: Segmentation

Raw Material

Components

Products, Parts & Devices

Software & Services

Applications

Silicon

Camera

Head-Mounted Displays

Documentation

3D Modelling/ Design- Shopping

GaN

Sensors

Smart Glass

Visualization

Training

SiC

IMU


3D modeling


Glass

Displays


Navigation


Plastic

Processors


Workflow optimization


Metals

Memory


Others


Others

Graphics


Audio


Module


Others


Based on geography, North America dominated the market in 2018 and is expected to show similar trends in the coming years. The growing e-commerce sector in the region is one of the major factors in creating demand for AR VR in logistics and supply chain. As eCommerce companies such as Amazon are increasing their spending on shipping, the demand for AR VR has increased in order to streamline the process and increase the efficiency of work.

The Asia Pacific is the fastest-growing region with a CAGR of XX% during the forecast period. Fast-growing economies, rising industrial production, increasing purchasing power of consumers are some of the major factors that are driving the growth of the logistics industry in the region. As the logistic industry is growing, the demand for AR VR in logistics and supply chain has been increasing in recent years. 

Growing competition among logistics companies is creating demand for on-time delivery to recipients, which in turn, is increasing the use of modern technologies by them for streamlining their processes. Microsoft HoloLens are being increasingly used in warehouses, which provide information regarding the position of items on the pallet. At the same time, it also indicates the right order for picking items.

There are many trends that are having an impact on the market forecast. These, when evaluated from a company’s perspective, can drive growth. Our numerous consulting projects have generated sizeable synergies across all regions and all sizes of companies.

AR VR in Logistics and Supply Chain Market Ecosystem: Key Players

Company

Ecosystem Positioning

Total Revenue

Industry

Region

Magic Leap

Product Manufacture

~$180 Million

AR VR industry

Global

Google LLC

Product Manufacture

$136.22 Billion

AR VR industry

Global

Lenovo

Product Manufacture

$14 Billion

AR VR industry

Global

HTC Corporation

Product Manufacture

$0.73 Billion

AR VR industry

Global

Facebook

Product Manufacture

$55 Billion

AR VR industry

Global

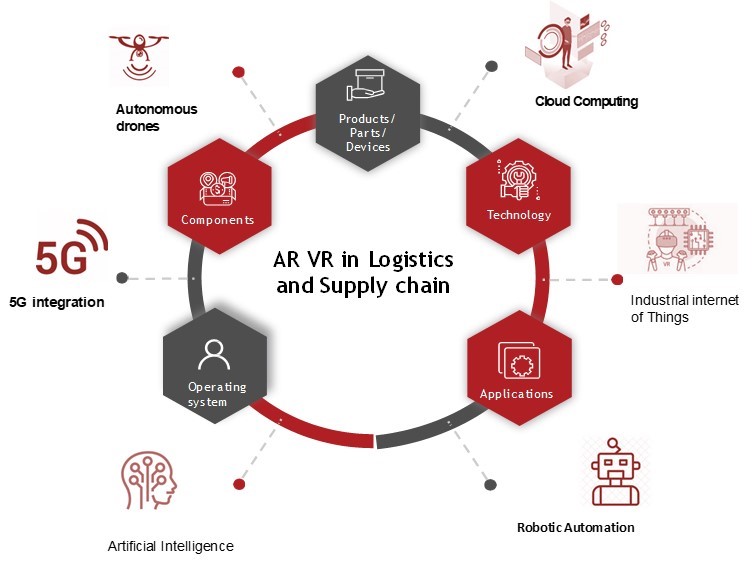
Very few markets have interconnectivity with other markets like AR VR. Our Interconnectivity module focuses on the key nodes of heterogenous markets in detail. autonomous drones, cloud computing, industrial internet of things, robotic automation, artificial intelligence and 5G are some of our key researched markets

AR VR in Logistics and Supply Chain Market Ecosystem Major Interconnectivities

AR VR in logistics and supply chain Ecosystem Major Interconnectivities

A Glance on Global AR VR in Logistics and Supply Chain Market Trends:

Trends

Application

Augmented reality is used in warehouse pickup solutions that provide information about the right position of items in the warehouses. Thus, it reduces the time required to complete the order and thereby increases the productivity of warehouse workers.

Monitoring

Virtual reality is used for training logistics employees such as truck drivers about shipments and warehouse workers about the warehouse. At the same time, it also trains workers about the safety timings of work.

Training  

Related Reports

Need specific market information ?

Ask for free product review call with the author

Share your specific research requirements for a customized report

Request for due diligence and consumer centric studies

Request for study updates, segment specific and country level reports

Ecosystem Report – Table of Content

  1. Introduction
    1. Global AR VR in Logistics and supply chain Ecosystem Definition
    2. Scope of study  
    3. About FABRIC

Customizations

  1. Ask for Customization
    1. Sensitivity Analysis
    2. TAM SAM SOM Analysis
    3. Other Customization
  2. Executive Summary
    1. Global Market Segmentation
    2. Global Market Overview
    3. Global Market Statistics
    4. Mega Trends
    5. Competitive Landscape
      1. SWOT
      2. PEST
      3. Company Ranking
    6. Market Attractiveness

Ecosystem Positioning

  1. Global AR VR in Logistics and supply chain Ecosystem Snapshot
    1. Global AR VR in Logistics and supply chain Ecosystem Broad Heads
      1. Demand Side
      2. Supply Side  
    2. Global AR VR in Logistics and supply chain Ecosystem Segmentation
      1.  By Raw Material
        1. Silicon
        2. GaN
        3. Glass
        4. Plastic
        5. SiC
        6. Metals
        7. Others
      2. By Components
        1. Sensors
        2. Camera
        3. IMU
        4. Processor
        5. Modules
        6. Graphics (Cards)
        7. Audio ICs
        8. Memory
        9. Display
        10. Others
      3.  By Product, Parts & Devices
        1. Head Mounted Displays
        2. Smart Glass
      4. By Services & Solutions
        1. Documentation
        2. Visualization
        3. 3D Modelling
        4. Navigation
        5. Workflow Optimization
        6. Others
      5. By Application
        1. Training
        2. Monitoring/ Maintenance
        3. Others
      6.  By Region
        1. North America
          1. U.S.
          2. Canada
          3. Mexico
        2. Asia Pacific
          1. China
          2. Japan
          3. India
          4. Australia
          5. South Korea
          6. Rest of APAC
        3. Europe
          1. UK
          2. France
          3. Germany
          4. Italy
          5. Spain
          6. Rest of Europe
        4. Rest of world
          1. LATAM
          2. MEA
  2. Competitive Landscape Mapping by Ecosystem Positioning
    1. Company by each node
    2. Vendor Landscaping
  3. Ecosystem Level Analysis

Trend Analysis

  1. Global AR VR in Logistics and supply chain Ecosystem Trends
    1. Trend Mapping
      1. Trend Description
      2. Trend Evaluation
        1. Impact
        2. Importance
        3. Remarks
      3. Trend Outlook (Short, Mid, Long Term)
      4. Trend Company Mapping
      5. Related Global AR VR in Logistics and supply chain Ecosystem Mapping
      6. Trend Region/Country Mapping

Global AR VR in Logistics and supply chain Ecosystem Regulatory Analysis

  1. Overview
    1. Regulatory Mapping
    2. Regulatory Impact
    3. Regulatory Interlinkage

Global AR VR in Logistics and supply chain Ecosystem Sizing, Volume and ASP Analysis & Forecast

  1. Global AR VR in Logistics and supply chain Ecosystem Sizing & Volume
    1. Cross-segmentation
    2. Global AR VR in Logistics and supply chain Ecosystem Sizing and Global AR VR in Logistics and supply chain Ecosystem Forecast
    3. Global AR VR in Logistics and supply chain Ecosystem Volume Analysis
    4. Average Selling Price Analysis
    5. Global AR VR in Logistics and supply chain Ecosystem Growth Analysis

Competitive Intelligence

  1. Competitive Intelligence
    1. Top Industry Players vs Trend Tagging
        1. Importance
        2. Trend Nature (Positive/ Negative)
        3. Value
        4. Interconnectivity for each vendor
    2. Global AR VR in Logistics and supply chain Ecosystem Share Analysis
        1. By Each Node
    3. Strategies Adopted by Global AR VR in Logistics and supply chain Ecosystem participants
        1. Global AR VR in Logistics and supply chain Ecosystem Strategies
        2. New product launch Strategies
        3. Geographic Expansion Strategies
        4. Product-line Expansion Strategies
        5. Operational / Efficiency building Strategies
        6. Other Strategies

Company Profiles

  1. Company Profiling Summary
    1. Company List & Fundamentals
    2. Ecosystem Positioning
  2. Company Profiles - including the:
    1. Google Inc.
      1. Company Fundamentals
      2. Subsidiaries list
      3. Share Holding Pattern
      4. Key Employees and Board of Directors
      5. Financial Analysis
        1. Financial Summary
        2. Ratio Analysis
        3. Valuation Metrics
      6. Product & Services
      7. Client & Strategies
      8. Ecosystem Presence
      9. SWOT
      10. Trends Mapping
      11. Analyst Views
    2. Intellectsoft
    3.  WeAR Studio
    4.  Codiant Software Technologies Pvt
    5. DHL
    6. Vuzix
    7. Magic Leap
    8. Apple
    9. WeAR Studio
    10. HTC Corporation
    11. Toshiba
    12. Kopin Corporation
    13. Epson
    14. Lenovo
    15. Sony Corporation
    16. Facebook
    17. IRISTICK
    18. Ubimax
    19. KNAPP
    20. SAP AR

Global AR VR in Logistics and supply chain Ecosystem Developments

  1. Global AR VR in Logistics and supply chain Ecosystem Events & Rationale
    1. R&D, Technology and Innovation
    2. Business & Corporate advancements
    3. M&A, JVs/Partnerships
    4.  Political, Macro-economic, Regulatory
    5.  Awards & Recognition
    6. Others

Research Methodology & Approach

  1. Research Methodology and Approach
    1. Assumptions/ Inferences
    2. Sources
      1. Primary Interviews
      2. Secondary Sources
        1. Key Secondary Webpages
        2. Whitepapers
        3. Annual Reports
        4. Investor/Analyst Presentations
    3. Appendix
    4. Contact

Choose License

License Type
Ask for Customization

Why Choose AllTheResearch?

  • Monthly market updates for 6 months
  • Online access of reports
  • Options to buy sections of report
  • Critically analysed research on Quadrant Positioning of your company.
  • Syndicated report along with a supplementary report with objective-based study
  • Get profiled in the reports.Expanding your visibility across our network of readers and viewers
  • We provide local market data in local language on request
  • A complementary co-branded white paper
  • Flat consulting fee based exclusive studies. Consult at the price of syndicate
  • Access to expert team for free transaction advisory service.
Speak to Analyst

Quick Inquiry

Follow Us

Choose License

License Type
Ask for Customization