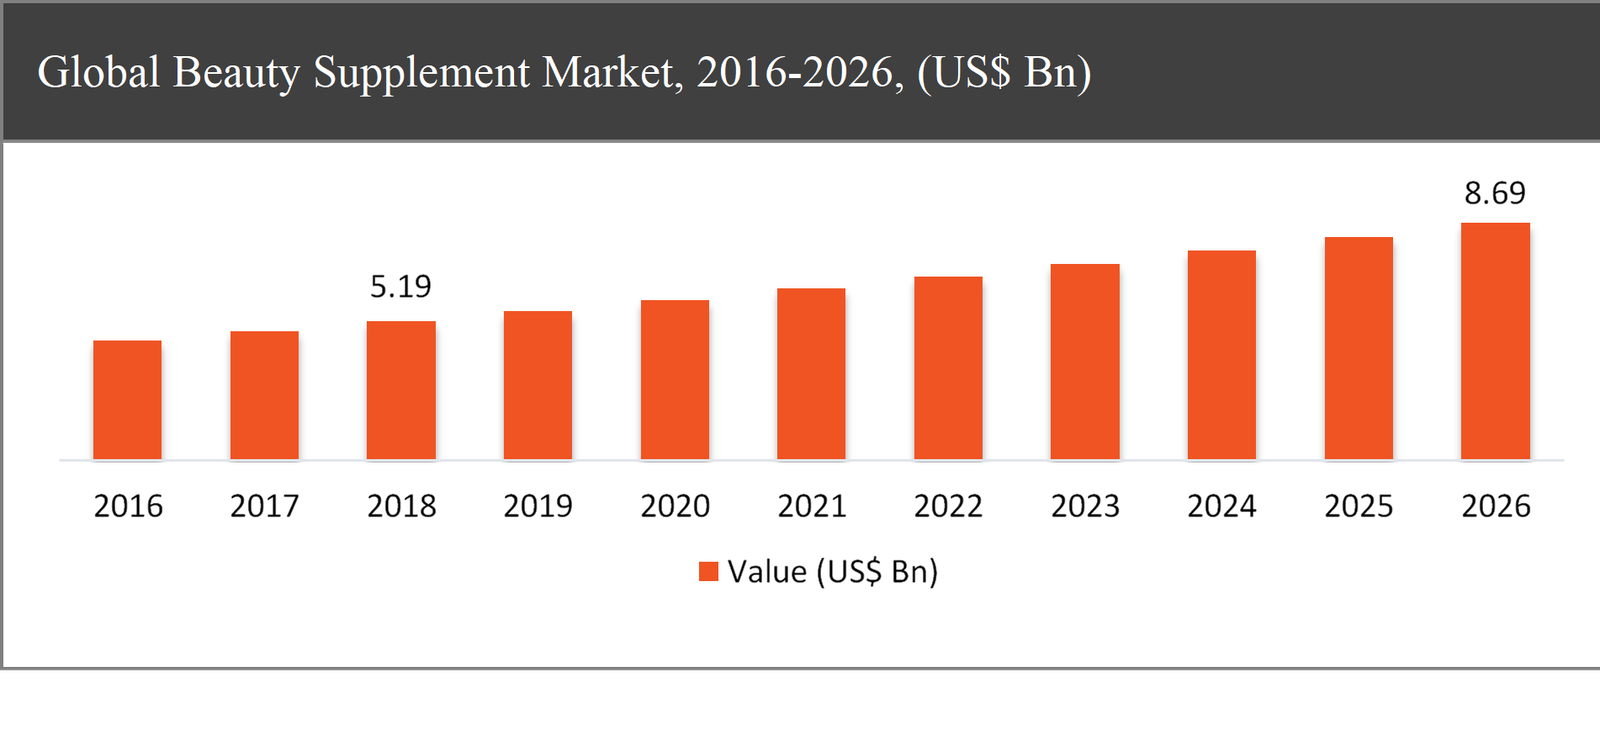
The global beauty supplement market was valued at USD 5.19 billion in 2018 and is expected to reach USD 8.69 billion in 2026, growing at a CAGR of 6.5% during the forecast period.
Beauty supplement are substances used to enhance, improve and sustain any type of human body deficiency. These are generally provided to customers in multiple forms such as pills, capsules, soft gels, or even in powdered or liquid form. Beauty supplement market is one of the main health and dietary supplements sections that is driven largely by increasing beauty and health issues among customers worldwide. In order to attract fresh consumer base, various products and supplements are frequently introduced by many manufactures.
Beauty Supplement Market Segmentation |
|
| By Supplements | 1. Tablets |
| 2. Capsules | |
| 3. Liquid | |
| 4. Powder | |
| 5. Oil | |
| 6. Others | |
| By Distribution channel | 1. Online |
| 2. Offline | |
| By Application | 1. Skin Care |
| 2. Hair care | |
| 3. Nail care | |
| 4. Others | |
| By Region | 1. North America (US and Canada) |
| 2. Europe (UK, Germany, France and Rest of Europe) | |
| 3. Asia Pacific (China, Japan, India and Rest of Asia Pacific) | |
| 4. Latin America (Brazil, Mexico and Rest of Latin America) | |
| 5. Middle East & Africa (GCC and Rest of Middle East & Africa) | |
Changing lifestyles and growing consumer consciousness of health led to increased consumer revenues and use of supplements. Moreover, the rising consumer self-obsession about their personal appearance and outlook drives the global beauty supplement market. The growth in population of male and female consumers' and growth in popularity of beauty supplements among millennial has largely impacted the beauty supplements industry, worldwide. With the big consumer base looking from the inside out for their commitment to beauty, the worldwide beauty is suppressing.
Based on the supplement, the tablets supplements expected to dominate the market throughout the forecast period
Based on the supplement, the beauty supplement market has been segmented into tablets, capsules, liquid, powder, oil, and others. In 2018, the tablets type beauty supplements are estimated for the largest share of nearly 28% in the market. While the capsules type beauty supplements are expected to grow at the highest CAGR in the future owing to the increasing significance of micro-encapsulation in the pharmaceutical industry is probable to force beauty supplements producers to use capsule dosage forms over the forecast period to ensure color features and quality of finished products.
Based on the distribution channel, the online segment account for the highest CAGR in the market throughout the forecast period
Based on the distribution channel, the Beauty Supplement market has been segmented into online and offline. The online distribution channel expected to grow at the highest CAGR of around 10.5% during the forecast period. The massive growth in the millennial population across the developed and developing countries, as well as the development in the online distribution network, are further create opportunities for the manufacturers to increase product offering at online channels to meet the demand for low-cost and high efficient beauty supplements.
Based on the application, the skin care segment expected to lead the market
Based on the application, the market has been segmented into skin care, hair care, nail care, and others. The beauty supplements for skin care are anticipated to dominate over the forecast period in terms of income followed by supplements for hair care. Moreover, the skin care supplements accounted for more than 55% share of the global beauty supplements market.
Europe is expected to dominate the global beauty supplement market in 2018
Globally, it is anticipated that Europe will dominate the market in terms of income and register almost 40% market share in the global beauty supplement market, followed during the forecast period by North America and Asia Pacific. Growth in Europe market for beauty supplements is supported by people's growing concern for their external outlook and appearance combined with elevated disposable consumer revenue.
Additionally, Asia Pacific anticipated the greatest growth rate owing to the presence of developing nations such as China & India. The growth in the digitalization and massive increase in the purchasing power of consumers in the region are primarily expected to increase the demand and sales for beauty supplement in the market over the forecast period.
Company Profiles and Competitive Intelligence:
The major players operating in the global beauty supplement market are Amway (US), Murad U.K Ltd. (U.K.), Life2good Inc.(Ireland), Neocell Corporation (US), The Boots Company (UK), HUM Nutrition Corporation (CA), Reserveage Nutrition, Llc , Vemedia (Netherland) and Vitabiotics Ltd(UK) among others.

Ask for free product review call with the author

Share your specific research requirements for a customized report

Request for due diligence and consumer centric studies

Request for study updates, segment specific and country level reports
Chapter 1 Executive Summary
1.1. Market Summary
1.1.1. Global Beauty Supplement Market, 2016-2026, (USD Million)
1.2. Market Snapshot: Global Beauty Supplement Market
1.3. Market Dynamics
1.4. Global Beauty Supplement Market, by Segment, 2018
1.4.1. Global Beauty Supplement Market, by Supplements, 2018, (USD Million)
1.4.2. Global Beauty Supplement Market, by Distribution Channel, 2018, (USD Million)
1.4.3. Global Beauty Supplement Market, by Application, 2018, (USD Million)
1.4.4. Global Beauty Supplement Market, by Region, 2018 (USD Million)
1.5. Premium Insights
1.5.1. Beauty Supplement Market in Developed Vs. Developing Economies, 2018 vs 2026
1.5.2. Global Beauty Supplement Market: Regional Life Cycle Analysis
Chapter 2 Market Dynamics
2.1. Market Overview
2.2. Market Drivers
2.2.1. Increasing in personal health and awareness
2.2.2. Growing number of aging population
2.3. Market Restraints
2.3.1. Less awareness among the consumer
2.3.2. Side effects of beauty supplement products
2.4. Market Opportunities
2.4.1. Distribution of product through online retail
2.4.2. New product development such as vegan product
2.5. Industry Value Chain Analysis
2.6. Pricing Analysis
2.7. Porter’s Five Forces Analysis
Chapter 3 Global Beauty Supplement Market, by Supplements
3.1. Market Overview, by Supplements
3.1.1. Global Beauty Supplement Market, by Supplements, 2016-2026 (USD Million)
3.1.2. Incremental Opportunity, by Supplements, 2018
3.2. Tablets
3.2.1. Global Beauty Supplement Market, by Tablets, 2016-2026, (USD Million)
3.3. Capsules
3.3.1. Global Beauty Supplement Market, by Capsules, 2016-2026, (USD Million)
3.4. Liquid
3.4.1. Global Beauty Supplement Market, by Liquid, 2016-2026, (USD Million)
3.5. Powder
3.5.1. Global Beauty Supplement Market, by Powder, 2016-2026, (USD Million)
3.6. Oil
3.6.1. Global Beauty Supplement Market, by Oil 2016-2026, (USD Million)
3.7. Others
3.7.1. Global Beauty Supplement Market, by Others, 2016-2026, (USD Million)
Chapter 4 Global Beauty Supplement Market, by Distribution Channel
4.1. Market Overview, by Distribution Channel
4.1.1. Global Beauty Supplement Market, by Distribution Channel, 2016-2026 (USD Million)
4.1.2. Incremental Opportunity, by Distribution Channel, 2018
4.2. Online
4.2.1. Global Beauty Supplement Market, by Online, 2016-2026, (USD Million)
4.3. Offline
4.3.1. Global Beauty Supplement Market, by Offline, 2016-2026, (USD Million)
Chapter 5 Global Beauty Supplement Market, by Application
5.1. Market Overview, by Application
5.1.1. Global Beauty Supplement Market, by Application, 2016-2026 (USD Million)
5.1.2. Incremental Opportunity, by Application, 2018
5.2. Skin Care
5.2.1. Global Beauty Supplement Market, by Skin Care, 2016-2026, (USD Million)
5.3. Hair Care
5.3.1. Global Beauty Supplement Market, by Hair Care, 2016-2026, (USD Million)
5.4. Nail Care
5.4.1. Global Beauty Supplement Market, by Nail Care, 2016-2026, (USD Million)
5.5. Others
5.5.1. Global Beauty Supplement Market, by Others, 2016-2026, (USD Million)
Chapter 6 Global Beauty Supplement Market, by Region
6.1. Market Overview, by Region
6.1.1. Global Beauty Supplement Market, by Region, 2016-2026, (USD Million)
6.2. Attractive Investment Opportunity, by Region, 2018
6.3. North America Beauty Supplement Market
6.3.1. North America Beauty Supplement Market, by Supplements, 2016-2026 (USD Million)
6.3.2. North America Beauty Supplement Market, by Distribution Channel, 2016-2026 (USD Million)
6.3.3. North America Beauty Supplement Market, by Application, 2016-2026 (USD Million)
6.3.4. United States Beauty Supplement Market, 2016-2026 (USD Million)
6.3.5. Canada Beauty Supplement Market, 2016-2026 (USD Million)
6.4. Europe Beauty Supplement Market
6.4.1. Europe Beauty Supplement Market, by Supplements, 2016-2026 (USD Million)
6.4.2. Europe Beauty Supplement Market, by Distribution Channel, 2016-2026 (USD Million)
6.4.3. Europe Beauty Supplement Market, by Application, 2016-2026 (USD Million)
6.4.4. United Kingdom Beauty Supplement Market, 2016-2026 (USD Million)
6.4.5. Germany Beauty Supplement Market, 2016-2026 (USD Million)
6.4.6. France Beauty Supplement Market, 2016-2026 (USD Million)
6.4.7. Rest of Europe Beauty Supplement Market, 2016-2026 (USD Million)
6.5. Asia Pacific Beauty Supplement Market
6.5.1. Asia Pacific Beauty Supplement Market, by Supplements, 2016-2026 (USD Million)
6.5.2. Asia Pacific Beauty Supplement Market, by Distribution Channel, 2016-2026 (USD Million)
6.5.3. Asia Pacific Beauty Supplement Market, by Application, 2016-2026 (USD Million)
6.5.4. China Beauty Supplement Market, 2016-2026 (USD Million)
6.5.5. Japan Beauty Supplement Market, 2016-2026 (USD Million)
6.5.6. India Beauty Supplement Market, 2016-2026 (USD Million)
6.5.7. Rest of Asia Pacific Beauty Supplement Market, 2016-2026 (USD Million)
6.6. Latin America Beauty Supplement Market
6.6.1. Latin America Beauty Supplement Market, by Supplements, 2016-2026 (USD Million)
6.6.2. Latin America Beauty Supplement Market, by Distribution Channel, 2016-2026 (USD Million)
6.6.3. Latin America Beauty Supplement Market, by Application, 2016-2026 (USD Million)
6.6.4. Brazil Beauty Supplement Market, 2016-2026 (USD Million)
6.6.5. Mexico Beauty Supplement Market, 2016-2026 (USD Million)
6.6.6. Rest of Latin America Beauty Supplement Market, 2016-2026 (USD Million)
6.7. Middle East & Africa Beauty Supplement Market
6.7.1. Middle East & Africa Beauty Supplement Market, by Supplements, 2016-2026 (USD Million)
6.7.2. Middle East & Africa Beauty Supplement Market, by Distribution Channel, 2016-2026 (USD Million)
6.7.3. Middle East & Africa Beauty Supplement Market, by Application, 2016-2026 (USD Million)
6.7.4. GCC Beauty Supplement Market, 2016-2026 (USD Million)
6.7.5. Rest of Middle East & Africa Beauty Supplement Market, 2016-2026 (USD Million)
Chapter 7 Competitive Intelligence
7.1. Top 5 Players Comparison
7.2. Market Positioning of Key Players, 2018
7.3. Market Players Mapping
7.3.1. By Supplements
7.3.2. By Distribution Channel
7.3.3. By Application
7.3.4. By Region
7.4. Strategies Adopted by Key Market Players
7.5. Recent Developments in the Market
7.5.1. Mergers & Acquisitions, Partnership, New Supplements Developments
Chapter 8 Company Profiles
8.1. Amway
8.1.1. Amway Overview
8.1.2. Amway Product Portfolio
8.1.3. Amway Financial Overview
8.1.4. Amway News/Recent Developments
8.2. Murad U.K Ltd.
8.2.1. Murad U.K Ltd. Overview
8.2.2. Murad U.K Ltd. Product Portfolio
8.2.3. Murad U.K Ltd. Financial Overview
8.2.4. Murad U.K Ltd. News/Recent Developments
8.3. Life2good Inc.
8.3.1. Life2good Inc. Overview
8.3.2. Life2good Inc. Product Portfolio
8.3.3. Life2good Inc. Financial Overview
8.3.4. Life2good Inc. News/Recent Developments
8.4. Neocell Corporation
8.4.1. Neocell Corporation Overview
8.4.2. Neocell Corporation Product Portfolio
8.4.3. Neocell Corporation Financial Overview
8.4.4. Neocell Corporation News/Recent Developments
8.5. The Boots Company
8.5.1. The Boots Company Overview
8.5.2. The Boots Company Product Portfolio
8.5.3. The Boots Company Financial Overview
8.5.4. The Boots Company News/Recent Developments
8.6. HUM Nutrition Corporation
8.6.1. HUM Nutrition Corporation Overview
8.6.2. HUM Nutrition Corporation Product Portfolio
8.6.3. HUM Nutrition Corporation Financial Overview
8.6.4. HUM Nutrition Corporation News/Recent Developments
8.7. Reserveage Nutrition, Llc
8.7.1. Reserveage Nutrition, Llc Overview
8.7.2. Reserveage Nutrition, Llc Product Portfolio
8.7.3. Reserveage Nutrition, Llc Financial Overview
8.7.4. Reserveage Nutrition, Llc News/Recent Developments
8.8. Vemedia
8.8.1. Vemedia Overview
8.8.2. Vemedia Product Portfolio
8.8.3. Vemedia Financial Overview
8.8.4. Vemedia News/Recent Developments
8.9. Vitabiotics Ltd
8.9.1. Vitabiotics Ltd Overview
8.9.2. Vitabiotics Ltd Product Portfolio
8.9.3. Vitabiotics Ltd Financial Overview
8.9.4. Vitabiotics Ltd News/Recent Developments
8.10. Imedeen (Pfizer Inc.)
8.10.1. Imedeen (Pfizer Inc.) Overview
8.10.2. Imedeen (Pfizer Inc.) Product Portfolio
8.10.3. Imedeen (Pfizer Inc.) Financial Overview
8.10.4. Imedeen (Pfizer Inc.) News/Recent Developments
Chapter 9 Preface
9.1. Data Triangulation
9.2. Research Methodology
9.2.1. Phase I – Secondary Research
9.2.2. Phase II – Primary Research
9.2.3. Phase III – Expert Panel Review
9.2.4. Approach Adopted
9.2.4.1. Top-Down Approach
9.2.4.2. Bottom-Up Approach
9.2.5. Supply- Demand side
9.2.6. Breakup of the Primary Profiles


 Log in / Register


