Shale oil is extracted from shale rock by using the hydraulic fracking technique and is used as an alternative to conventional energy sources. With the decreasing availability of other fuels, innovations are made in the extraction methods used for obtaining shale oil. Shale oil can be used as a substitute for other energy sources such as crude oil, coal, fossil fuels, and others. The retorting process is being used in extracting shale oil, where it is exposed to high temperatures in the absence of oxygen.
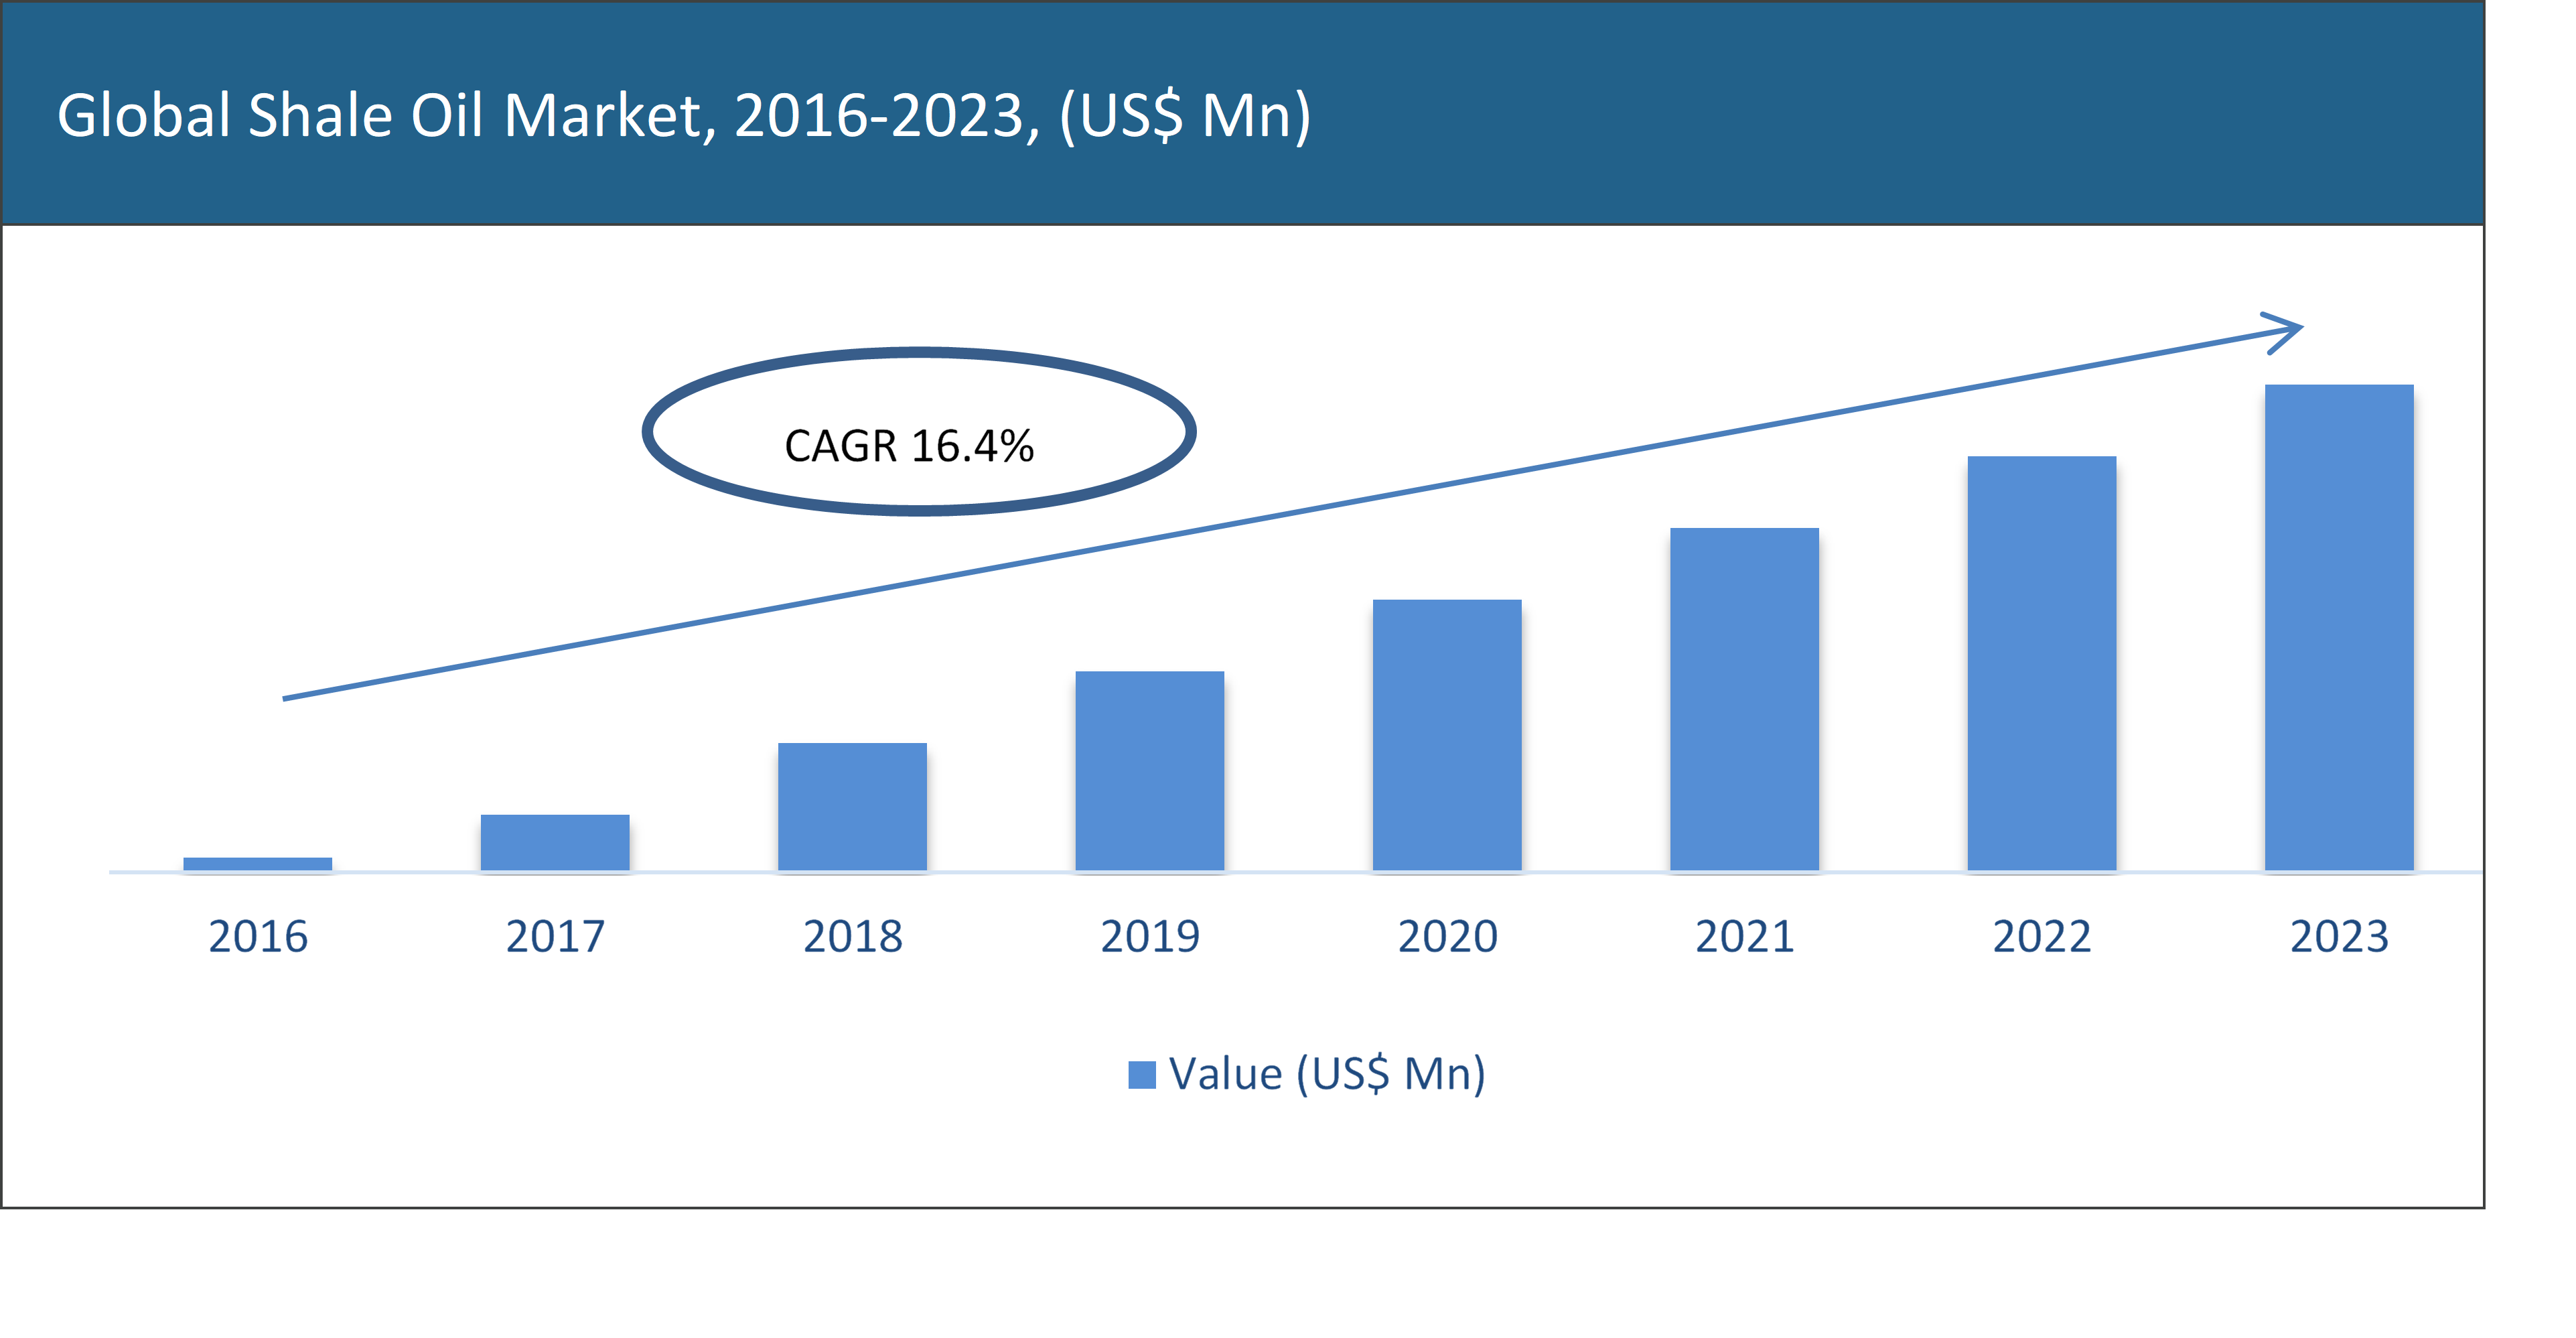
The global shale oil market is expected to grow at a CAGR of 16.4% during the forecast period. Shale oil is primarily used as a source of power generation in the industrial sector. It is also being used as a fuel to drive the turbines in thermal power plants. Due to increasing industrialization, the global demand for shale oil is rising. The high cost associated with the extraction of shale oil may hinder the growth of the global shale oil market. Moreover, there have been high investments in research and development of other energy sources as an alternative to conventional energy sources, which will further propel the shale oil market.
The shale oil market is segmented on the basis of process, technology, product and application. On the basis of process, the market has been segmented as ore preparation, shale oil exploration, shale oil retorting, shale oil refining, and others. In the process for shale oil extraction, kerogen which is present in oil shale, under the process of pyrolysis, gets converted to shale oil.
On the basis of regions, North America is having the highest share in the market due the presence of major players in the region such as Anadarko Petroleum Corporation, ConocoPhillips, Marathon Oil Corporation, and others. In addition to this, this region produces shale oil in large quantities and is further expected to invest in the market. Moreover, the Asia-Pacific region is expected to witness significant growth in the shale oil market during the forecast years due to rising investments in substitutes for conventional energy sources.
By Process
By Product
By Technology
By Application
Region coverd in Shale Oil Market are
North America
Europe
Asia Pacific
LATAM
Middle East Africa
Key players in the Shale Oil market

Ask for free product review call with the author

Share your specific research requirements for a customized report

Request for due diligence and consumer centric studies

Request for study updates, segment specific and country level reports
Table of Content
Chapter 1 Preface
1.1 Report Description
1.1.1 Purpose of the Report
1.1.2 Target Audience
1.1.3 USP and Key Offerings
1.2 Research Scope
1.3 Research Methodology
1.3.1 Phase I – Secondary Research
1.3.2 Phase II – Primary Research
1.3.3 Phase III – Expert Panel Review
1.3.4 Approach Adopted
1.3.4.1 Top-Down Approach
1.3.4.2 Bottom-Up Approach
1.3.5 Assumptions
1.4 Market Segmentation Scope
Chapter 2 Executive Summary
2.1 Market Summary
2.1.1 Global Shale Oil Market, 2016-2023, (Per Barrel) (US$ Mn)
2.1 Market Snapshot: Global Shale Oil Market
2.2 Market Dynamics
2.3 Global Shale Oil Market, by Segment, 2018
2.3.1 Global Shale Oil Market, by Process, 2018, (Per Barrel) (US$ Mn)
2.3.2 Global Shale Oil Market, by Product, 2018, (Per Barrel) (US$ Mn)
2.3.3 Global Shale Oil Market, by Technology, 2018 (Per Barrel) (US$ Mn)
2.3.4 Global Shale Oil Market, by Application, 2018 (Per Barrel) (US$ Mn)
2.3.5 Global Shale Oil Market, by Region, 2018 (Per Barrel) (US$ Mn)
2.4 Premium Insights
2.4.1 Shale Oil Market In Developed Vs. Developing Economies, 2018 vs 2023
2.4.2 Global Shale Oil Market: Regional Life Cycle Analysis
Chapter 3 Market Dynamics
3.1 Market Overview
3.2 Market Drivers
3.2.1 Growing use of shale oil as a source of power generation in industrial sector
3.2.2 Increasing use of shale oil in production of sulphur and ammonia
3.2.3 Driver 3
3.3 Market Restraints
3.3.1 Increasing salinity of water during extraction process
3.3.2 Restraint 2
3.4 Market Opportunities
3.4.1 Need for an alternative for conventional energy source
3.4.2 Opportunity 2
3.5 Industry Value Chain Analysis
3.5.1 Analyst’s Views
3.6 Industry SWOT Analysis
Chapter 4 Global Shale Oil Market, by Process
4.1 Market Overview, by Process
4.1.1 Global Shale Oil Market, by Process, 2016-2023 (Per Barrel) (US$ Mn)
4.1.2 Incremental Opportunity, by Process, From 2018-2023
4.2 Shale Oil Exploration
4.2.1 Global Shale Oil Market, by Shale Oil Exploration, 2016-2023, (Per Barrel) (US$ Mn)
4.3 Ore Preparation
4.3.1 Global Shale Oil Market, by Ore Preparation, 2016-2023, (Per Barrel) (US$ Mn)
4.4 Shale Oil Retorting
4.4.1 Global Shale Oil Market, by Shale Oil Retorting, 2016-2023, (Per Barrel) (US$ Mn)
4.5 Shale Oil Refining
4.5.1 Global Shale Oil Market, by Shale Oil Refining, 2016-2023, (Per Barrel) (US$ Mn)
4.6 Others
4.6.1 Global Shale Oil Market, by Others, 2016-2023, (Per Barrel) (US$ Mn)
Chapter 5 Global Shale Oil Market, by Product
5.1 Market Overview, by Product
5.1.1 Global Shale Oil Market, by Product, 2016-2023 (Per Barrel) (US$ Mn)
5.1.2 Incremental Opportunity, by Product, From 2018-2023
5.2 Shale Oil
5.2.1 Global Shale Oil Market, by Shale Oil, 2016-2023, (Per Barrel) (US$ Mn)
5.3 Kerosene
5.3.1 Global Shale Oil Market, by Kerosene, 2016-2023, (Per Barrel) (US$ Mn)
5.4 Diesel
5.4.1 Global Shale Oil Market, by Diesel, 2016-2023, (Per Barrel) (US$ Mn)
5.5 Propane and Butane Gas
5.5.1 Global Shale Oil Market, by Propane and Butane Gas, 2016-2023, (Per Barrel) (US$ Mn)
Chapter 6 Global Shale Oil Market, by Technology
6.1 Market Overview, by Technology
6.1.1 Global Shale Oil Market, by Technology, 2016-2023 (Per Barrel) (US$ Mn)
6.1.2 Incremental Opportunity, by Technology, From 2018-2023
6.2 In-situ
6.2.1 Global Shale Oil Market, by In-situ, 2016-2023, (Per Barrel) (US$ Mn)
6.3 Ex-situ
6.3.1 Global Shale Oil Market, by Ex-situ, 2016-2023, (Per Barrel) (US$ Mn)
Chapter 7 Global Shale Oil Market, by Application
7.1 Market Overview, by Application
7.1.1 Global Shale Oil Market, by Application, 2016-2023 (Per Barrel) (US$ Mn)
7.1.2 Incremental Opportunity, by Application, From 2018-2023
7.2 Fuel
7.2.1 Global Shale Oil Market, by Fuel, 2016-2023, (Per Barrel) (US$ Mn)
7.3 Electricity
7.3.1 Global Shale Oil Market, by Electricity, 2016-2023, (Per Barrel) (US$ Mn)
7.4 Chemicals
7.4.1 Global Shale Oil Market, by Chemicals, 2016-2023, (Per Barrel) (US$ Mn)
7.5 Others
7.5.1 Global Shale Oil Market, by Others, 2016-2023, (Per Barrel) (US$ Mn)
Chapter 8 Global Shale Oil Market, by Region
8.1 Market Overview, by Region
8.1.1 Global Shale Oil Market, by Region, 2016-2023, (Per Barrel) (US$ Mn)
8.2 Attractive Investment Opportunity, by Region, 2018
8.3 North America Shale Oil Market
8.3.1 North America Shale Oil Market, by Process, 2016-2023 (Per Barrel) (US$ Mn)
8.3.2 North America Shale Oil Market, by Product, 2016-2023 (Per Barrel) (US$ Mn)
8.3.3 North America Shale Oil Market, by Technology, 2016-2023 (Per Barrel) (US$ Mn)
8.3.4 North America Shale Oil Market, by Application, 2016-2023 (Per Barrel) (US$ Mn)
8.3.5 United States Country Profile
8.3.5.1 United States Shale Oil Market, 2016-2023 (Per Barrel) (US$ Mn)
8.3.6 Canada Country Profile
8.3.6.1 Canada Shale Oil Market, 2016-2023 (Per Barrel) (US$ Mn)
8.3.7 Mexico Country Profile
8.3.7.1 Mexico Shale Oil Market, 2016-2023 (Per Barrel) (US$ Mn)
8.4 Europe Shale Oil Market
8.4.1 Europe Shale Oil Market, by Process, 2016-2023 (Per Barrel) (US$ Mn)
8.4.2 Europe Shale Oil Market, by Product, 2016-2023 (Per Barrel) (US$ Mn)
8.4.3 Europe Shale Oil Market, by Technology, 2016-2023 (Per Barrel) (US$ Mn)
8.4.4 Europe Shale Oil Market, by Application, 2016-2023 (Per Barrel) (US$ Mn)
8.4.5 United Kingdom Country Profile
8.4.5.1 United Kingdom Shale Oil Market, 2016-2023 (Per Barrel) (US$ Mn)
8.4.6 Germany Country Profile
8.4.6.1 Germany Shale Oil Market, 2016-2023 (Per Barrel) (US$ Mn)
8.4.7 France Country Profile
8.4.7.1 France Shale Oil Market, 2016-2023 (Per Barrel) (US$ Mn)
8.4.8 Italy Country Profile
8.4.8.1 Italy Shale Oil Market, 2016-2023 (Per Barrel) (US$ Mn)
8.4.9 Spain Country Profile
8.4.9.1 Spain Shale Oil Market, 2016-2023 (Per Barrel) (US$ Mn)
8.4.10 Rest of Europe
8.4.10.1 Rest of Europe Shale Oil Market, 2016-2023 (Per Barrel) (US$ Mn)
8.5 Asia Pacific Shale Oil Market
8.5.1 Asia Pacific Shale Oil Market, by Process, 2016-2023 (Per Barrel) (US$ Mn)
8.5.2 Asia Pacific Shale Oil Market, by Product, 2016-2023 (Per Barrel) (US$ Mn)
8.5.3 Asia Pacific Shale Oil Market, by Technology, 2016-2023 (Per Barrel) (US$ Mn)
8.5.4 Asia Pacific Shale Oil Market, by Application, 2016-2023 (Per Barrel) (US$ Mn)
8.5.5 China Country Profile
8.5.5.1 China Shale Oil Market, 2016-2023 (Per Barrel) (US$ Mn)
8.5.6 Japan Country Profile
8.5.6.1 Japan Shale Oil Market, 2016-2023 (Per Barrel) (US$ Mn)
8.5.7 India Country Profile
8.5.7.1 India Shale Oil Market, 2016-2023 (Per Barrel) (US$ Mn)
8.5.8 Indonesia Country Profile
8.5.8.1 Indonesia Shale Oil Market, 2016-2023 (Per Barrel) (US$ Mn)
8.5.9 Thailand Country Profile
8.5.9.1 Thailand Shale Oil Market, 2016-2023 (Per Barrel) (US$ Mn)
8.5.10 Rest of Asia Pacific
8.5.10.1 Rest of Asia Pacific Shale Oil Market, 2016-2023 (Per Barrel) (US$ Mn)
8.6 Latin America Shale Oil Market
8.6.1 Latin America Shale Oil Market, by Process, 2016-2023 (Per Barrel) (US$ Mn)
8.6.2 Latin America Shale Oil Market, by Product, 2016-2023 (Per Barrel) (US$ Mn)
8.6.3 Latin America Shale Oil Market, by Technology, 2016-2023 (Per Barrel) (US$ Mn)
8.6.4 Latin America Shale Oil Market, by Application, 2016-2023 (Per Barrel) (US$ Mn)
8.6.5 Brazil Country Profile
8.6.5.1 Brazil Shale Oil Market, 2016-2023 (Per Barrel) (US$ Mn)
8.6.6 Argentina Country Profile
8.6.6.1 Argentina Shale Oil Market, 2016-2023 (Per Barrel) (US$ Mn)
8.6.7 Rest of Latin America
8.6.7.1 Rest of Latin America Shale Oil Market, 2016-2023 (Per Barrel) (US$ Mn)
8.7 Middle East & Africa Shale Oil Market
8.7.1 Middle East & Africa Shale Oil Market, by Process, 2016-2023 (Per Barrel) (US$ Mn)
8.7.2 Middle East & Africa Shale Oil Market, by Product, 2016-2023 (Per Barrel) (US$ Mn)
8.7.1 Middle East & Africa Shale Oil Market, by Technology, 2016-2023 (Per Barrel) (US$ Mn)
8.7.2 Middle East & Africa Shale Oil Market, by Application, 2016-2023 (Per Barrel) (US$ Mn)
8.7.3 Southern Africa
8.7.3.1 Southern Africa Shale Oil Market, 2016-2023 (Per Barrel) (US$ Mn)
8.7.4 Northern Africa
8.7.4.1 Northern Africa Shale Oil Market, 2016-2023 (Per Barrel) (US$ Mn)
8.7.5 GCC
8.7.5.1 GCC Shale Oil Market, 2016-2023 (Per Barrel) (US$ Mn)
8.7.6 Rest of Middle East & Africa
8.7.6.1 Rest of Middle East & Africa Shale Oil Market, 2016-2023 (Per Barrel) (US$ Mn)
Chapter 9 Competitive Intelligence
9.1 Market Players Present in Market Life Cycle
9.2 Top 5 Players Comparison
9.3 Market Positioning of Key Players, 2018
9.4 Market Players Mapping
9.4.1 By Process
9.4.2 By Product
9.4.3 By Application
9.4.4 By Region
9.5 Strategies Adopted by Key Market Players
9.6 Recent Developments in the Market
9.6.1 Mergers & Acquisitions, Partnership, New Developments
9.7 Operational Efficiency Comparison by Key Players
Chapter 10 Company Profiles
10.1 Bossard Holding AG
10.1.1 BP Overview
10.1.2 Key Stakeholders/Person in Bossard Holding AG
10.1.3 BP Products Portfolio
10.1.4 BP Financial Overview
10.1.5 BP News/Recent Developments
10.2 Chevron
10.2.1 Chevron Overview
10.2.2 Key Stakeholders/Person in Chevron
10.2.3 Chevron Products Portfolio
10.2.4 Chevron Financial Overview
10.2.5 Chevron News/Recent Developments
10.3 ConocoPhillips
10.3.1 ConocoPhillips Overview
10.3.2 Key Stakeholders/Person in ConocoPhillips
10.3.3 ConocoPhillips Products Portfolio
10.3.4 ConocoPhillips Financial Overview
10.3.5 ConocoPhillips News/Recent Developments
10.4 Electro-Petroleum, Inc.
10.4.1 Electro-Petroleum, Inc. Overview
10.4.2 Key Stakeholders/Person in Electro-Petroleum, Inc.
10.4.3 Electro-Petroleum, Inc. Products Portfolio
10.4.4 Electro-Petroleum, Inc. Financial Overview
10.4.5 Electro-Petroleum, Inc. News/Recent Developments
10.5 Exxon Mobil
10.5.1 Exxon Mobil Overview
10.5.2 Key Stakeholders/Person in Exxon Mobil
10.5.3 Exxon Mobil Products Portfolio
10.5.4 Exxon Mobil Financial Overview
10.5.5 Exxon Mobil News/Recent Developments
10.6 Fushun Mining Group
10.6.1 Fushun Mining Group Overview
10.6.2 Key Stakeholders/Person in Fushun Mining Group
10.6.3 Fushun Mining Group Products Portfolio
10.6.4 Fushun Mining Group Financial Overview
10.6.5 Fushun Mining Group News/Recent Developments
10.7 Mountain West Energy, LLC
10.7.1 Mountain West Energy, LLC Overview
10.7.2 Key Stakeholders/Person in Mountain West Energy, LLC
10.7.3 Mountain West Energy, LLC Products Portfolio
10.7.4 Mountain West Energy, LLC Financial Overview
10.7.5 Mountain West Energy, LLC News/Recent Developments
10.8 Petrobras
10.8.1 Petrobras Overview
10.8.2 Key Stakeholders/Person in Petrobras
10.8.3 Petrobras Products Portfolio
10.8.4 Petrobras Financial Overview
10.8.5 Petrobras News/Recent Developments
10.9 Royal Dutch Shell
10.9.1 Royal Dutch Shell Overview
10.9.2 Key Stakeholders/Person in Royal Dutch Shell
10.9.3 Royal Dutch Shell Products Portfolio
10.9.4 Royal Dutch Shell Financial Overview
10.9.5 Royal Dutch Shell News/Recent Developments
10.10 Statoil
10.10.1 Statoil Overview
10.10.2 Key Stakeholders/Person in Statoil
10.10.3 Statoil Products Portfolio
10.10.4 Statoil Financial Overview
10.10.5 Statoil News/Recent Developments


 Log in / Register


