Global AR VR Display Market Ecosystem By Raw Material; By Display; by Devices; by End User (Automotive, Aerospace, Defense, Logistics, Retail, Healthcare, Consumer, Others), by region

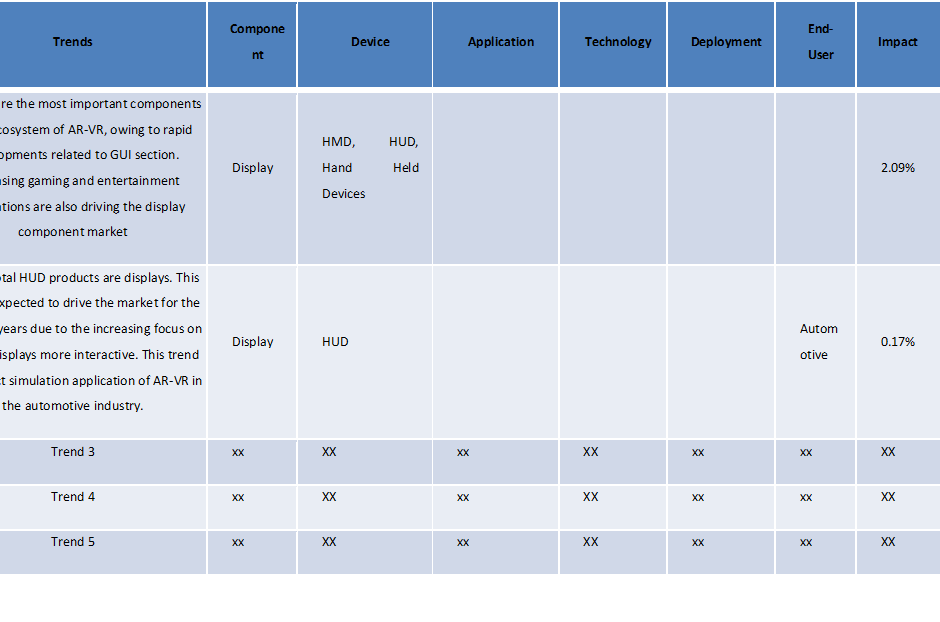
AR VR Display Market Ecosystem is rapidly gaining traction due to its pivotal application in AR VR devices. In AR VR devices, display is the most important component, and it accounts for around 35% of the AR VR product cost. Product innovation and advanced display technology in terms of high resolution or high display density and improved computing power have increased the demand for advanced AR VR Display Market Ecosystem products.

The increasing number of AR VR devices applications in recent years has generated the demand for AR VR devices in end-user industries, such as gaming, entertainment, training, and enterprise applications. Thus, based on the end-user application, the demand for AR VR display changes and to address this issue, device manufacturing companies are developing advanced features in devices based on that particular industry’s requirement.

Ecosystem Snapshot: AR VR Display Market Ecosystem

AR VR Display Market Ecosystem

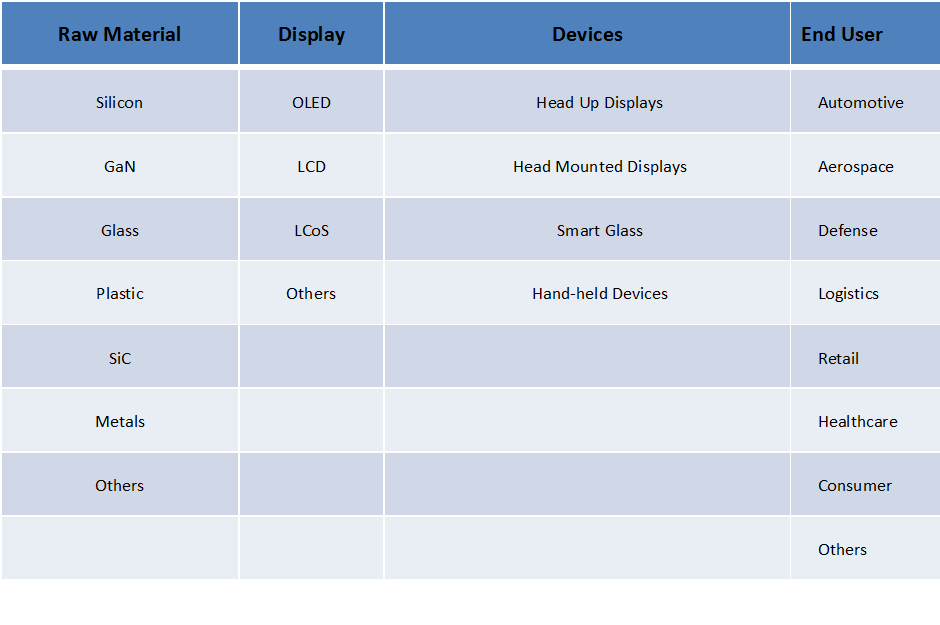
The common AR VR products in which AR VR display component is used are, head mounted display (HMD), head up display (HUD), smart glass, and handheld devices. Based on the type of display and the technology used, display features and the immersive experience vary. The currently used display technologies in AR VR Display Market Ecosystem are LCD (Liquid crystal Display), OLED (Organic light emitting diodes), and LCoS (Liquid crystal on silicon). LCoS and variants of OLED are dominating the current AR VR Display Market Ecosystem.

The rising use of AR VR Display Market Ecosystem products will generate the demand for high quality and pure raw materials to manufacture these AR VR components. Thus, raw material suppliers can build long-term partnerships and joint ventures with component providers in AR VR Display Market Ecosystem.

 AR VR Display Market Ecosystem: Segmentation of AR VR Display Market Ecosystem

AR VR Display Market Ecosystem: Segmentation of AR VR Display Market Ecosystem

Global AR VR Display Market Ecosystem

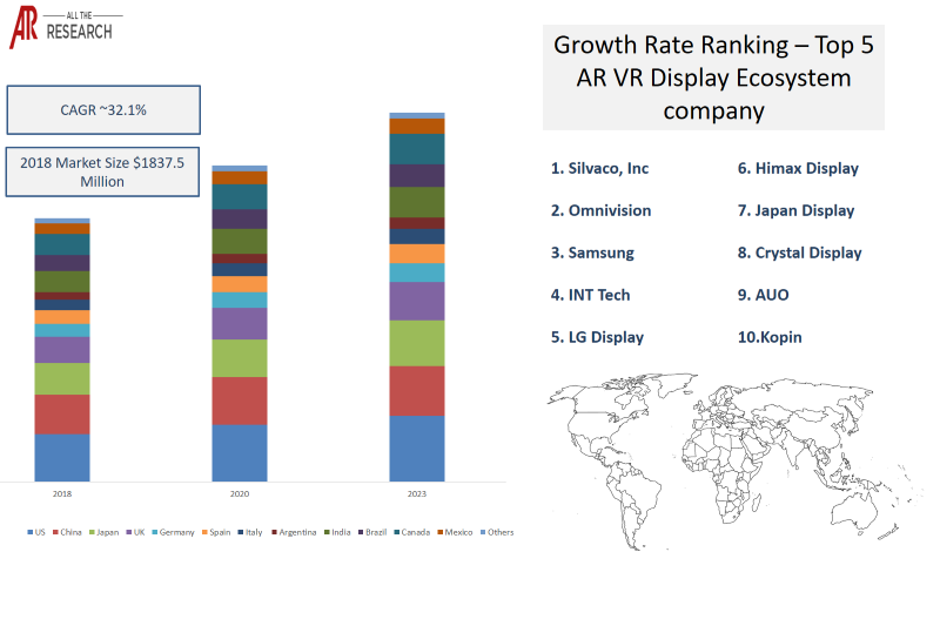
Based on regions, the Asia Pacific region dominated the AR VR Display Market Ecosystem in 2018 and is expected to witness similar trends in the coming years. The presence of major players in AR VR Display Market Ecosystem, such as Samsung, LG display, Japan Display, INT, and others, is driving the growth of the AR VR Display Market Ecosystem in the region. The Asia Pacific region is expected to grow at the fastest pace with a CAGR of XX% during the forecast period due to the increasing demand for AR VR components such as display. This is expected to drive the growth of the AR VR Display Market Ecosystem in Asia Pacific during the forecast period.

The major players in the AR VR Display Market Ecosystem are mainly focusing on mergers and acquisitions, joint ventures, backward and forward integrations, and partnerships for strengthening their presence in the market. For instance, in 2017, INT Tech and UltraChip, which is an AMOLED driver IC design house, entered into a partnership to enhance product development and supply chain. The common AR VR Display Market Ecosystem solutions provided by companies such as Japan display, Samsung, LG, and Himex are in the product development and accessory development phases. The market will witness high growth during the forecast period due to the increasing adoption of the technology and the rising use of AR VR by end-user sectors such as consumer, healthcare, automotive, aerospace, etc.

Market Statistics Glimpse: AR VR Display Market Ecosystem

Market Statistics Glimpse: AR VR Display Market Ecosystem

There are many trends that are having an impact on the market forecast. These, when evaluated from a company’s perspective, can drive growth. Our numerous consulting projects have generated sizeable synergies across all regions and all sizes of companies.

The major players operating in the global AR VR Display Market Ecosystem are as follows:

Company

Ecosystem Positioning

Total Revenue

Industry

Region

Samsung

Component Manufacture

USD 218 Billion

AR VR Display

Global

LG Electronics

Component Manufacture

USD 54.4 billion

AR VR Display

Global

Japan Display

Component Manufacture

USD 6.5 billion

AR VR Display

Global

Will Semiconductor (Omnivision)

Component Manufacture

USD 5.7 Billion

AR VR Display

Global

Himax Technologies

Component Manufacture

USD 0.7 Billion

AR VR Display

Global


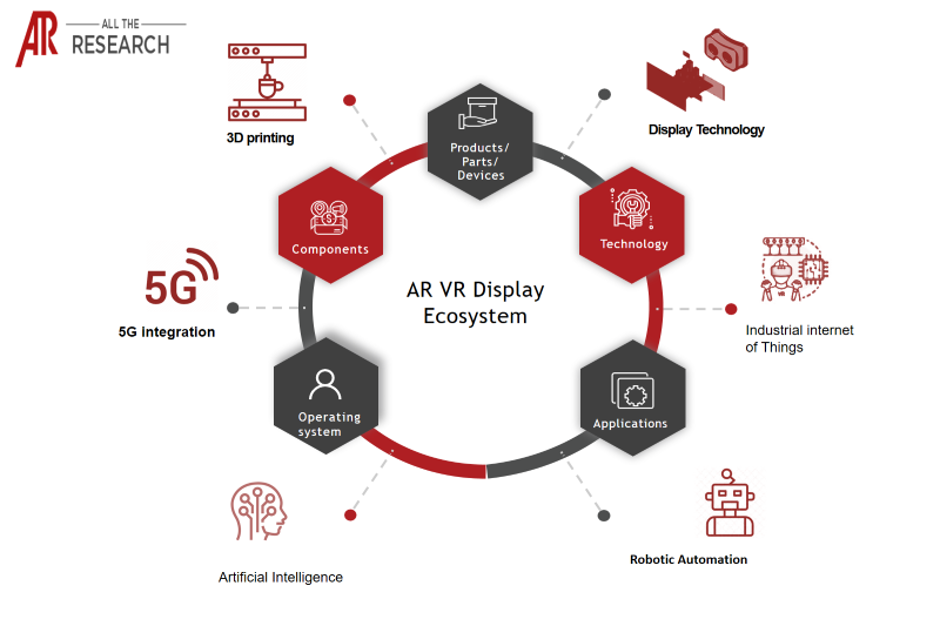
Very few markets have the interconnectivity with other markets like AR VR. Our Interconnectivity module focuses on the key nodes of heterogeneous markets in detail. Artificial intelligence, Industrial Internet of Things (IIOT), Cloud Computing, display technology, mobile computing, and 5G markets are some of our key researched markets.

 AR VR Display Industry Major Interconnectivities Ecosystem

AR VR Major Interconnectivities Ecosystem

A Glance on Global AR VR Display Market Ecosystem Trends:

A Glance on Global AR VR Display Ecosystem Trends:

Related Reports

Need specific market information ?

Ask for free product review call with the author

Share your specific research requirements for a customized report

Request for due diligence and consumer centric studies

Request for study updates, segment specific and country level reports

Ecosystem Report – Table of Content

  1. Introduction
    1. Global AR VR DisplayEcosystem Definition
    2. Scope of study 
    3. About FABRIC

Customizations

  1. Ask for Customization
    1. Sensitivity Analysis
    2. TAM SAM SOM Analysis
    3. Other Customization
  2. Executive Summary
    1. Global Market Segmentation
    2. Global Market Overview
    3. Global Market Statistics
    4. Mega Trends
    5. Competitive Landscape
      1. SWOT
      2. PEST
      3. Company Ranking
    6. Market Attractiveness

Ecosystem Positioning

  1. Global AR VR DisplayEcosystem Snapshot
    1. Global AR VR DisplayEcosystem Broad Heads
      1. Demand Side
      2. Supply Side 
    2. Global AR VR DisplayEcosystem Segmentation
      1. By Raw Material
        1. Silicon
        2. GaN
        3. Glass
        4. Plastic
        5. SiC
        6. Metals
        7. Others
      2. By Display Type
        1. OLED
        2. LCD
        3. LCoS
        4. Others
      3. By Product Type
        1. Head Mounted Displays
        2. Head Up Display
        3. Smart Glass
        4. Hand Held Devices
        5. AR Screens
      4. By Region
        1. North America
          1. U.S.
          2. Canada
          3. Mexico
        2. Asia Pacific
          1. China
          2. Japan
          3. India
          4. Australia
          5. South Korea
          6. Rest of APAC
        3. Europe
          1. UK
          2. France
          3. Germany
          4. Italy
          5. Spain
          6. Rest of Europe
        4. Rest of world
          1. LATAM
          2. MEA
  2. Competitive Landscape Mapping by Ecosystem Positioning
    1. Company by each node
    2. Vendor Landscaping
  3. Ecosystem Level Analysis

Trend Analysis

  1. Global AR VR DisplayEcosystem Trends
    1. Trend Mapping
      1. Trend Description
      2. Trend Evaluation
        1. Impact
        2. Importance
        3. Remarks
      3. Trend Outlook (Short, Mid, Long Term)
      4. Trend Company Mapping
      5. Related Global AR VR DisplayEcosystem Mapping
      6. Trend Region/Country Mapping

Global AR VR DisplayEcosystem Regulatory Analysis

  1. Overview
    1. Regulatory Mapping
    2. Regulatory Impact
    3. Regulatory Interlinkage

Global AR VR DisplayEcosystem Sizing, Volume and ASP Analysis & Forecast

  1. Global AR VR DisplayEcosystem Sizing & Volume
    1. Cross-segmentation
    2. Global AR VR DisplayEcosystem Sizing and Global AR VR DisplayEcosystem Forecast
    3. Global AR VR DisplayEcosystem Volume Analysis
    4. Average Selling Price Analysis
    5. Global AR VR DisplayEcosystem Growth Analysis

Competitive Intelligence

  1. Competitive Intelligence
    1. Top Industry Players vs Trend Tagging
        1. Importance
        2. Trend Nature (Positive/ Negative)
        3. Value
        4. Interconnectivity for each vendor
    2. Global AR VR DisplayEcosystem Share Analysis
        1. By Each Node
    3. Strategies Adopted by Global AR VR DisplayEcosystem participants
        1. Global AR VR DisplayEcosystem Strategies
        2. New product launch Strategies
        3. Geographic Expansion Strategies
        4. Product-line Expansion Strategies
        5. Operational / Efficiency building Strategies
        6. Other Strategies

Company Profiles

  1. Company Profiling Summary
    1. Company List & Fundamentals
    2. Ecosystem Positioning
  2. Company Profiles - including the:
    1. Google Inc.
      1. Company Fundamentals
      2. Subsidiaries list
      3. Share Holding Pattern
      4. Key Employees and Board of Directors
      5. Financial Analysis
        1. Financial Summary
        2. Ratio Analysis
        3. Valuation Metrics
      6. Product & Services
      7. Client & Strategies
      8. Ecosystem Presence
      9. SWOT
      10. Trends Mapping
      11. Analyst Views
    2. Microsoft
    3. Facebook
    4. HTC
    5. Magic leap
    6. Immersive
    7. Samsung
    8. UNIMERSIV
    9. BISim
    10. BAE System
    11. Daqri
    12. Kopin Corporation, Inc.
    13. Vuzix Corporation
    14. Eon Reality
    15. WorldViz
    16. Veative
    17. Yeppar
    18. One Bonsai
    19. VRMADA
    20. Future Visual

Global AR VR DisplayEcosystem Developments

  1. Global AR VR DisplayEcosystem Events & Rationale
    1. R&D, Technology and Innovation
    2. Business & Corporate advancements
    3. M&A, JVs/Partnerships
    4.  Political, Macro-economic, Regulatory
    5.  Awards & Recognition
    6. Others

Research Methodology & Approach

  1. Research Methodology and Approach
    1. Assumptions/ Inferences
    2. Sources
      1. Primary Interviews
      2. Secondary Sources
        1. Key Secondary Webpages
        2. Whitepapers
        3. Annual Reports
        4. Investor/Analyst Presentations
    3. Appendix
    4. Contact

Choose License

License Type
Ask for Customization

Why Choose AllTheResearch?

  • Monthly market updates for 6 months
  • Online access of reports
  • Options to buy sections of report
  • Critically analysed research on Quadrant Positioning of your company.
  • Syndicated report along with a supplementary report with objective-based study
  • Get profiled in the reports.Expanding your visibility across our network of readers and viewers
  • We provide local market data in local language on request
  • A complementary co-branded white paper
  • Flat consulting fee based exclusive studies. Consult at the price of syndicate
  • Access to expert team for free transaction advisory service.
Speak to Analyst

Quick Inquiry

Follow Us

Choose License

License Type
Ask for Customization